

signal strength 1 of 5
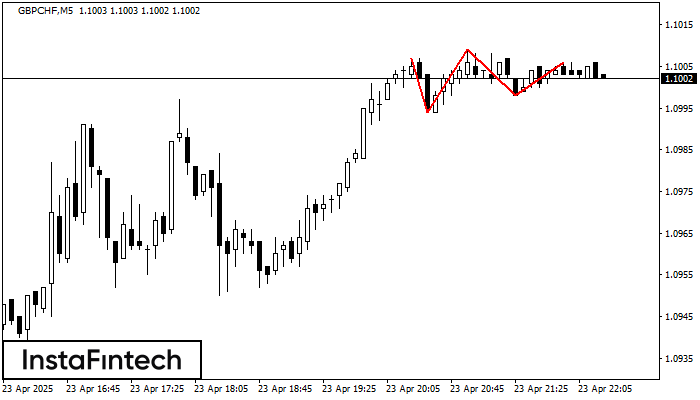
On the chart of the GBPCHF M5 trading instrument, the Triple Top pattern that signals a trend change has formed. It is possible that after formation of the third peak, the price will try to break through the resistance level 1.0994, where we advise to open a trading position for sale. Take profit is the projection of the pattern’s width, which is 13 points.
The M5 and M15 time frames may have more false entry points.
Juga lihat
- All
- Double Top
- Flag
- Head and Shoulders
- Pennant
- Rectangle
- Triangle
- Triple top
- All
- #AAPL
- #AMZN
- #Bitcoin
- #EBAY
- #FB
- #GOOG
- #INTC
- #KO
- #MA
- #MCD
- #MSFT
- #NTDOY
- #PEP
- #TSLA
- #TWTR
- AUDCAD
- AUDCHF
- AUDJPY
- AUDUSD
- EURCAD
- EURCHF
- EURGBP
- EURJPY
- EURNZD
- EURRUB
- EURUSD
- GBPAUD
- GBPCHF
- GBPJPY
- GBPUSD
- GOLD
- NZDCAD
- NZDCHF
- NZDJPY
- NZDUSD
- SILVER
- USDCAD
- USDCHF
- USDJPY
- USDRUB
- All
- M5
- M15
- M30
- H1
- D1
- All
- Buy
- Sale
- All
- 1
- 2
- 3
- 4
- 5
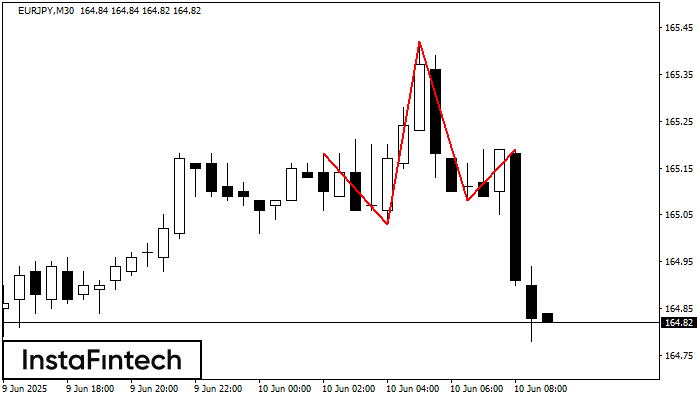
Corak teknikal yang dipanggil Head dan Shoulders telah muncul pada carta EURJPY M30. Terdapat alasan yang berat untuk menunjukkan bahawa harga akan mengatasi garisan Neck 165.03/165.08 selepas Shoulder kanan telah
Open chart in a new window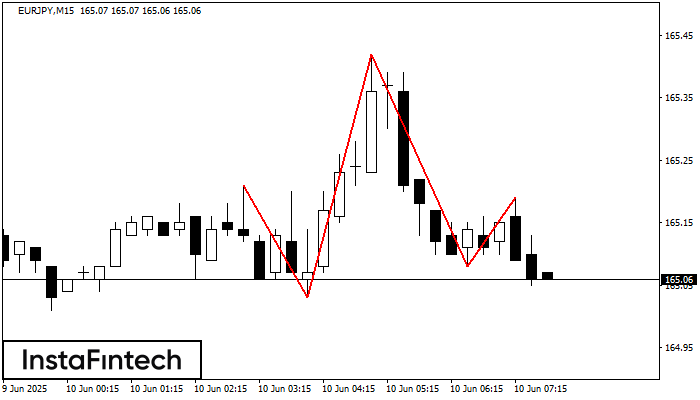
Corak teknikal yang dipanggil Head dan Shoulders telah muncul pada carta EURJPY M15. Terdapat alasan yang berat untuk menunjukkan bahawa harga akan mengatasi garisan Neck 165.03/165.08 selepas Shoulder kanan telah
Carta masa M5 dan M15 mungkin mempunyai lebih banyak titik kemasukan palsu.
Open chart in a new window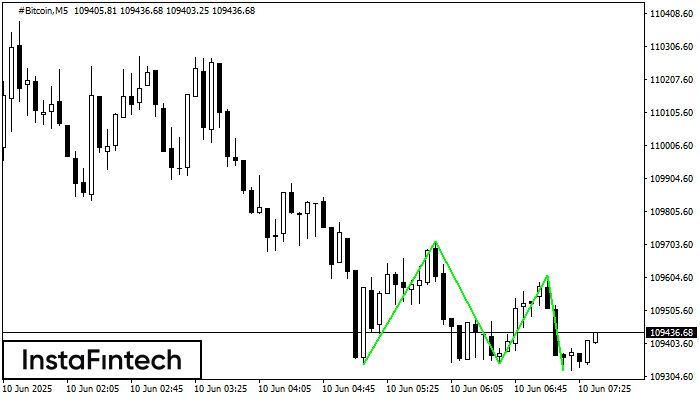
Corak Triple Bottom telah dibentuk pada carta bagi instrumen dagangan #Bitcoin M5. Corak menandakan perubahan aliran dari menurun ke aliran menaik dalam sekiranya penembusan 109714.17/109611.62
Carta masa M5 dan M15 mungkin mempunyai lebih banyak titik kemasukan palsu.
Open chart in a new window


