


signal strength 2 of 5
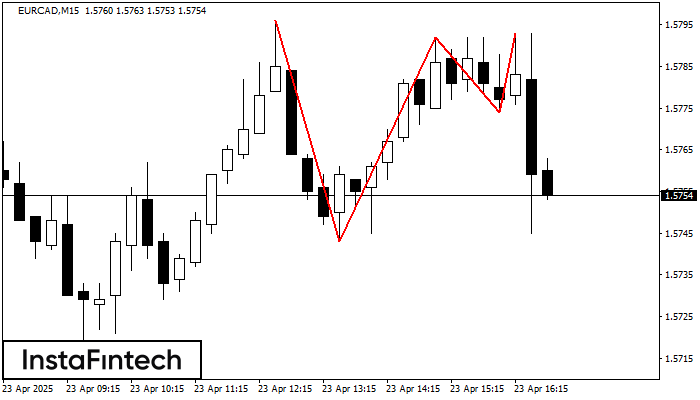
The Triple Top pattern has formed on the chart of the EURCAD M15. Features of the pattern: borders have an ascending angle; the lower line of the pattern has the coordinates 1.5743/1.5774 with the upper limit 1.5796/1.5793; the projection of the width is 53 points. The formation of the Triple Top figure most likely indicates a change in the trend from upward to downward. This means that in the event of a breakdown of the support level of 1.5743, the price is most likely to continue the downward movement.
The M5 and M15 time frames may have more false entry points.
Juga lihat
- All
- Double Top
- Flag
- Head and Shoulders
- Pennant
- Rectangle
- Triangle
- Triple top
- All
- #AAPL
- #AMZN
- #Bitcoin
- #EBAY
- #FB
- #GOOG
- #INTC
- #KO
- #MA
- #MCD
- #MSFT
- #NTDOY
- #PEP
- #TSLA
- #TWTR
- AUDCAD
- AUDCHF
- AUDJPY
- AUDUSD
- EURCAD
- EURCHF
- EURGBP
- EURJPY
- EURNZD
- EURRUB
- EURUSD
- GBPAUD
- GBPCHF
- GBPJPY
- GBPUSD
- GOLD
- NZDCAD
- NZDCHF
- NZDJPY
- NZDUSD
- SILVER
- USDCAD
- USDCHF
- USDJPY
- USDRUB
- All
- M5
- M15
- M30
- H1
- D1
- All
- Buy
- Sale
- All
- 1
- 2
- 3
- 4
- 5
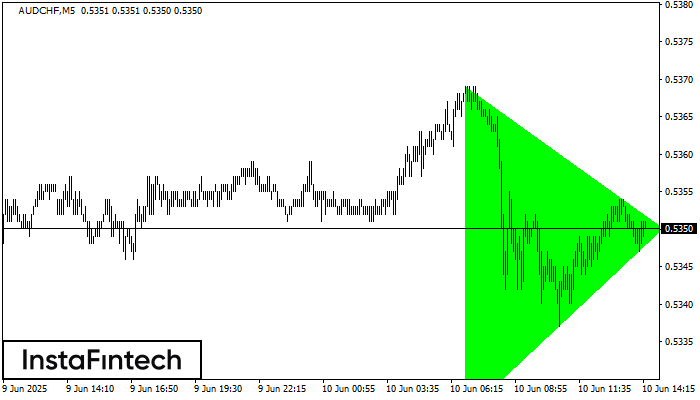
According to the chart of M5, AUDCHF formed the Bullish Symmetrical Triangle pattern. The lower border of the pattern touches the coordinates 0.5325/0.5350 whereas the upper border goes across 0.5369/0.5350
The M5 and M15 time frames may have more false entry points.
Open chart in a new window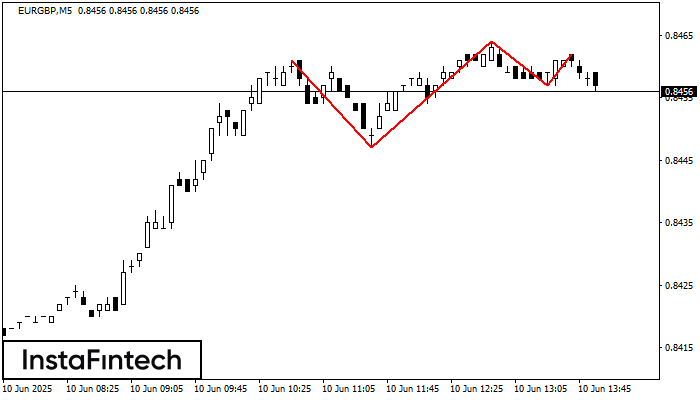
The Triple Top pattern has formed on the chart of the EURGBP M5. Features of the pattern: borders have an ascending angle; the lower line of the pattern
The M5 and M15 time frames may have more false entry points.
Open chart in a new window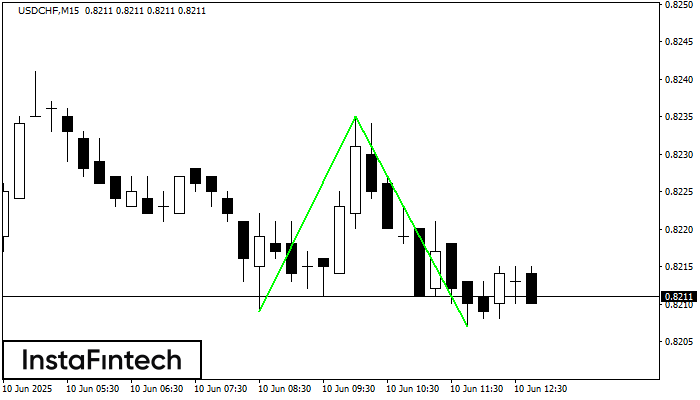
The Double Bottom pattern has been formed on USDCHF M15; the upper boundary is 0.8235; the lower boundary is 0.8207. The width of the pattern is 26 points. In case
The M5 and M15 time frames may have more false entry points.
Open chart in a new window


