

signal strength 2 of 5
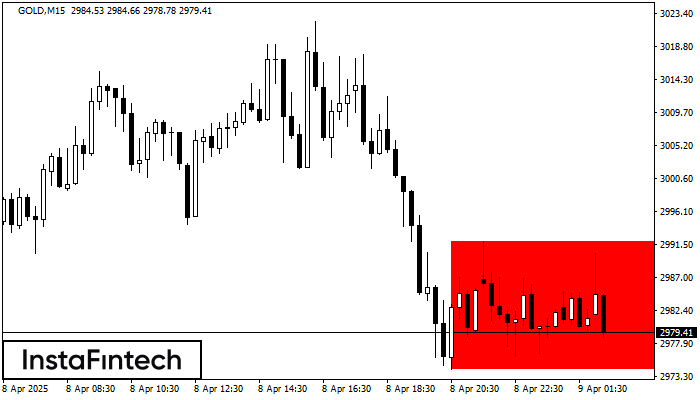
According to the chart of M15, GOLD formed the Bearish Rectangle. This type of a pattern indicates a trend continuation. It consists of two levels: resistance 2991.89 - 0.00 and support 2974.26 – 2974.26. In case the resistance level 2974.26 - 2974.26 is broken, the instrument is likely to follow the bearish trend.
The M5 and M15 time frames may have more false entry points.
Juga lihat
- All
- Double Top
- Flag
- Head and Shoulders
- Pennant
- Rectangle
- Triangle
- Triple top
- All
- #AAPL
- #AMZN
- #Bitcoin
- #EBAY
- #FB
- #GOOG
- #INTC
- #KO
- #MA
- #MCD
- #MSFT
- #NTDOY
- #PEP
- #TSLA
- #TWTR
- AUDCAD
- AUDCHF
- AUDJPY
- AUDUSD
- EURCAD
- EURCHF
- EURGBP
- EURJPY
- EURNZD
- EURRUB
- EURUSD
- GBPAUD
- GBPCHF
- GBPJPY
- GBPUSD
- GOLD
- NZDCAD
- NZDCHF
- NZDJPY
- NZDUSD
- SILVER
- USDCAD
- USDCHF
- USDJPY
- USDRUB
- All
- M5
- M15
- M30
- H1
- D1
- All
- Buy
- Sale
- All
- 1
- 2
- 3
- 4
- 5
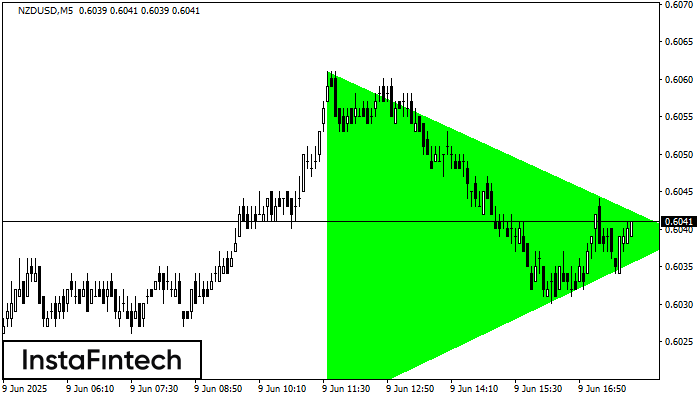
Berdasarkan carta M5, NZDUSD membentuk corak Segi Tiga Simetri Menaik yang menandakan aliran akan berterusan. Penerangan. Sempadan atas corak menyentuh koordinat 0.6061/0.6039 sedangkan sempadan bawah merentasi 0.6016/0.6039. Lebar corak diukur
Carta masa M5 dan M15 mungkin mempunyai lebih banyak titik kemasukan palsu.
Open chart in a new window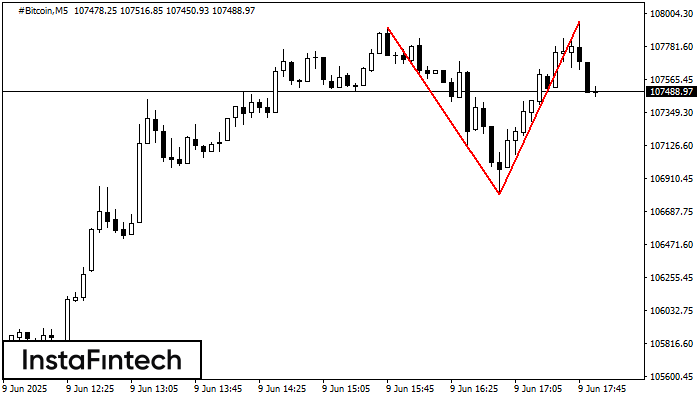
Pada carta #Bitcoin M5 corak pembalikan Double Top telah terbentuk. Ciri-ciri: sempadan atas 107950.30; sempadan bawah 106806.78; lebar corak 114352 mata. Isyarat: penembusan sempadan bawah akan menyebabkan kesinambungan arah aliran
Carta masa M5 dan M15 mungkin mempunyai lebih banyak titik kemasukan palsu.
Open chart in a new window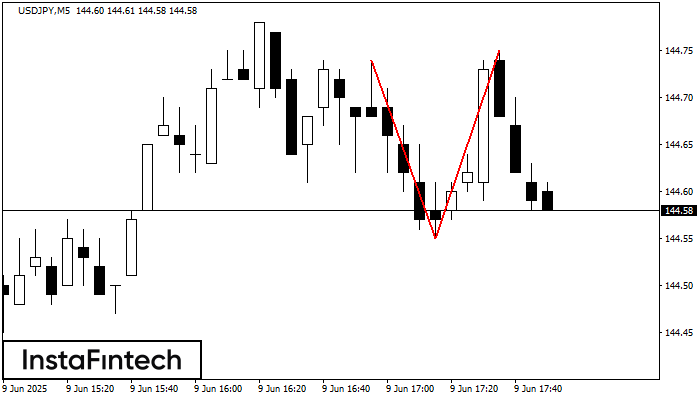
Corak pembalikan Double Top telah dibentuk pada USDJPY M5. Ciri-ciri: sempadan atas %P0.000000; sempadan bawah 144.74; sempadan bawah 144.55; lebar corak adalah 20 mata. Dagangan menjual adalah lebih baik untuk
Carta masa M5 dan M15 mungkin mempunyai lebih banyak titik kemasukan palsu.
Open chart in a new window


