


signal strength 1 of 5
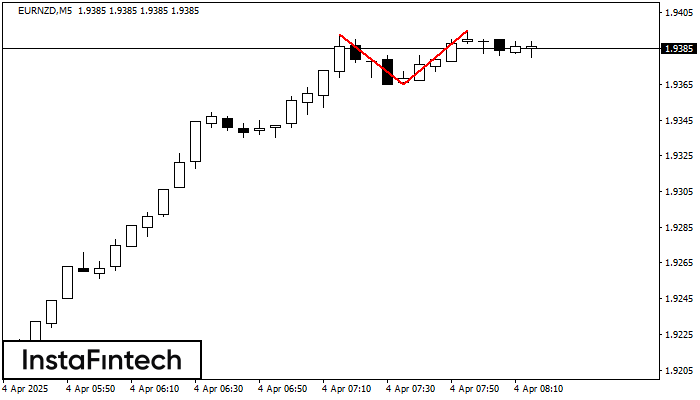
The Double Top reversal pattern has been formed on EURNZD M5. Characteristics: the upper boundary 1.9393; the lower boundary 1.9365; the width of the pattern is 30 points. Sell trades are better to be opened below the lower boundary 1.9365 with a possible movements towards the 1.9350 level.
The M5 and M15 time frames may have more false entry points.
- All
- Double Top
- Flag
- Head and Shoulders
- Pennant
- Rectangle
- Triangle
- Triple top
- All
- #AAPL
- #AMZN
- #Bitcoin
- #EBAY
- #FB
- #GOOG
- #INTC
- #KO
- #MA
- #MCD
- #MSFT
- #NTDOY
- #PEP
- #TSLA
- #TWTR
- AUDCAD
- AUDCHF
- AUDJPY
- AUDUSD
- EURCAD
- EURCHF
- EURGBP
- EURJPY
- EURNZD
- EURRUB
- EURUSD
- GBPAUD
- GBPCHF
- GBPJPY
- GBPUSD
- GOLD
- NZDCAD
- NZDCHF
- NZDJPY
- NZDUSD
- SILVER
- USDCAD
- USDCHF
- USDJPY
- USDRUB
- All
- M5
- M15
- M30
- H1
- D1
- All
- Buy
- Sale
- All
- 1
- 2
- 3
- 4
- 5

The Double Bottom pattern has been formed on #Bitcoin M5; the upper boundary is 84198.05; the lower boundary is 83772.49. The width of the pattern is 43677 points. In case
The M5 and M15 time frames may have more false entry points.
Open chart in a new window
According to the chart of M5, USDCHF formed the Bullish Symmetrical Triangle pattern. The lower border of the pattern touches the coordinates 0.8198/0.8221 whereas the upper border goes across 0.8238/0.8221
The M5 and M15 time frames may have more false entry points.
Open chart in a new window
The Bearish Flag pattern has been formed on the chart AUDCAD M5. Therefore, the downwards trend is likely to continue in the nearest term. As soon as the price breaks
The M5 and M15 time frames may have more false entry points.
Open chart in a new window


