

signal strength 3 of 5

According to the chart of M30, EURUSD formed the Bullish Symmetrical Triangle pattern. Description: This is the pattern of a trend continuation. 1.0849 and 1.0777 are the coordinates of the upper and lower borders respectively. The pattern width is measured on the chart at 72 pips. Outlook: If the upper border 1.0849 is broken, the price is likely to continue its move by 1.0844.
Juga lihat
- All
- Double Top
- Flag
- Head and Shoulders
- Pennant
- Rectangle
- Triangle
- Triple top
- All
- #AAPL
- #AMZN
- #Bitcoin
- #EBAY
- #FB
- #GOOG
- #INTC
- #KO
- #MA
- #MCD
- #MSFT
- #NTDOY
- #PEP
- #TSLA
- #TWTR
- AUDCAD
- AUDCHF
- AUDJPY
- AUDUSD
- EURCAD
- EURCHF
- EURGBP
- EURJPY
- EURNZD
- EURRUB
- EURUSD
- GBPAUD
- GBPCHF
- GBPJPY
- GBPUSD
- GOLD
- NZDCAD
- NZDCHF
- NZDJPY
- NZDUSD
- SILVER
- USDCAD
- USDCHF
- USDJPY
- USDRUB
- All
- M5
- M15
- M30
- H1
- D1
- All
- Buy
- Sale
- All
- 1
- 2
- 3
- 4
- 5
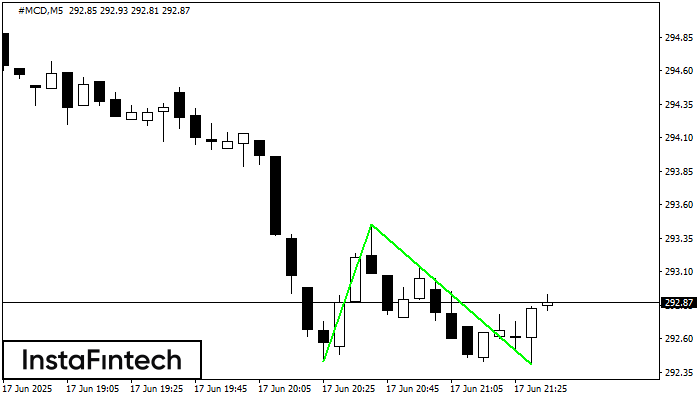
The Double Bottom pattern has been formed on #MCD M5; the upper boundary is 293.45; the lower boundary is 292.41. The width of the pattern is 102 points. In case
The M5 and M15 time frames may have more false entry points.
Открыть график инструмента в новом окне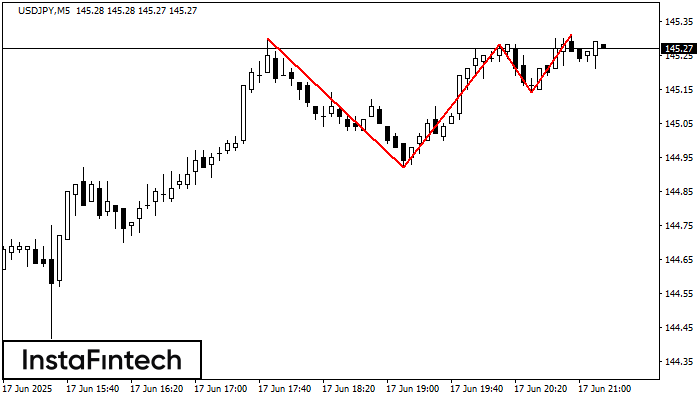
The Triple Top pattern has formed on the chart of the USDJPY M5 trading instrument. It is a reversal pattern featuring the following characteristics: resistance level -1, support level -22
The M5 and M15 time frames may have more false entry points.
Открыть график инструмента в новом окне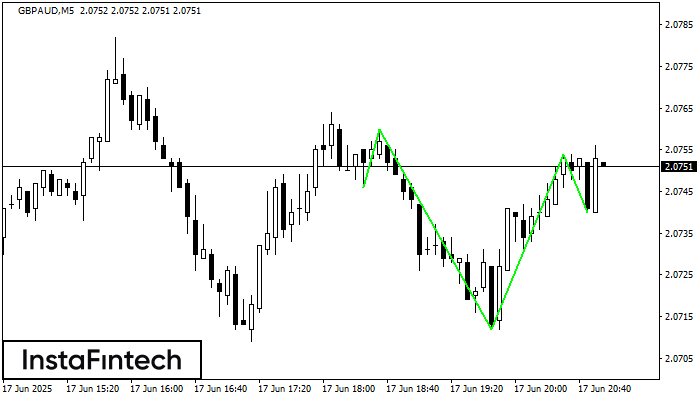
According to the chart of M5, GBPAUD produced the pattern termed the Inverse Head and Shoulder. The Head is fixed at 2.0712 while the median line of the Neck
The M5 and M15 time frames may have more false entry points.
Открыть график инструмента в новом окне


