

signal strength 1 of 5
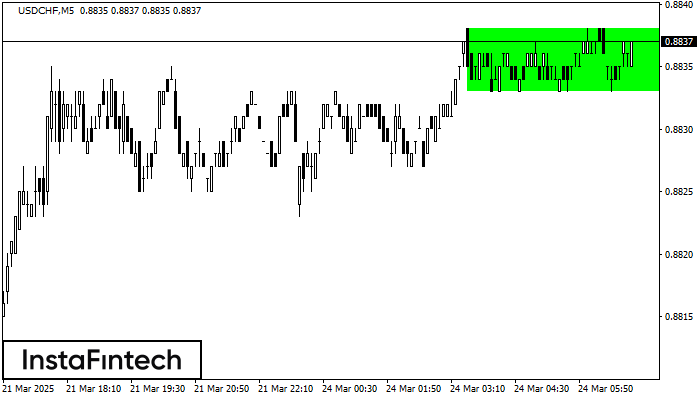
According to the chart of M5, USDCHF formed the Bullish Rectangle. This type of a pattern indicates a trend continuation. It consists of two levels: resistance 0.8838 and support 0.8833. In case the resistance level 0.8838 - 0.8838 is broken, the instrument is likely to follow the bullish trend.
The M5 and M15 time frames may have more false entry points.
Juga lihat
- All
- Double Top
- Flag
- Head and Shoulders
- Pennant
- Rectangle
- Triangle
- Triple top
- All
- #AAPL
- #AMZN
- #Bitcoin
- #EBAY
- #FB
- #GOOG
- #INTC
- #KO
- #MA
- #MCD
- #MSFT
- #NTDOY
- #PEP
- #TSLA
- #TWTR
- AUDCAD
- AUDCHF
- AUDJPY
- AUDUSD
- EURCAD
- EURCHF
- EURGBP
- EURJPY
- EURNZD
- EURRUB
- EURUSD
- GBPAUD
- GBPCHF
- GBPJPY
- GBPUSD
- GOLD
- NZDCAD
- NZDCHF
- NZDJPY
- NZDUSD
- SILVER
- USDCAD
- USDCHF
- USDJPY
- USDRUB
- All
- M5
- M15
- M30
- H1
- D1
- All
- Buy
- Sale
- All
- 1
- 2
- 3
- 4
- 5
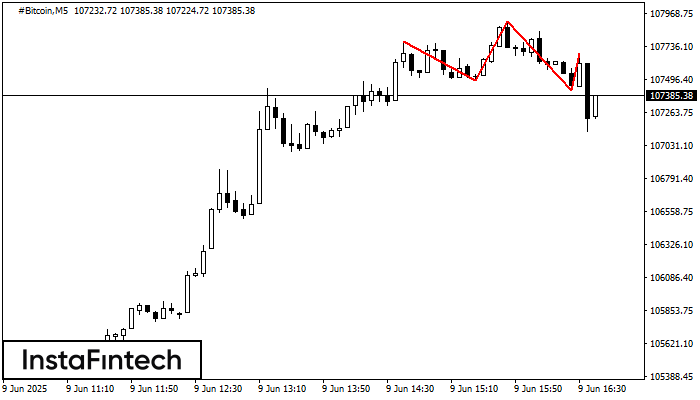
#Bitcoin M5 membentuk corak Head dan Shoulders dengan ciri-ciri berikut: Bahagian atas Head adalah 107912.77, garisan Neck dan sudut menaik berada pada 107491.49/107422.45. Pembentukan corak ini boleh membawa perubahan dalam
Carta masa M5 dan M15 mungkin mempunyai lebih banyak titik kemasukan palsu.
Open chart in a new window
According to M15, #INTC is shaping the technical pattern – the Inverse Head dan Shoulder. In case the Neckline 20.54/20.43 is broken out, the instrument is likely to move toward
Carta masa M5 dan M15 mungkin mempunyai lebih banyak titik kemasukan palsu.
Open chart in a new window
Corak Flag Aliran Menaik telah dibentuk pada carta #AMZN M5 yang memberi isyarat bahawa aliran menaik akan berterusan. Isyarat: penembusan bahagian atas pada 213.88 boleh menolak harga yang lebih tinggi
Carta masa M5 dan M15 mungkin mempunyai lebih banyak titik kemasukan palsu.
Open chart in a new window


