сила сигнала 1 из 5
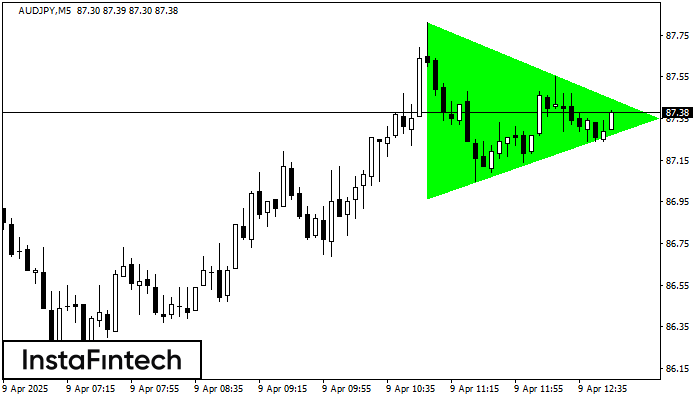
По AUDJPY на M5 сформировалась фигура «Бычий симметричный треугольник», которая сигнализирует нам о продолжении тенденции. Характеристика: Верхняя граница фигуры имеет координаты 87.81/87.35; Нижняя граница 86.97/87.35; Проекция ширины фигуры 84 пунктов. Формирование фигуры «Бычий симметричный треугольник» на восходящем тренде свидетельствует о продолжении текущего движения, где, в случае пробоя значения 87.35, возможно движение к 87.50.
Таймфреймы М5 и М15 могут иметь больше ложных точек входа.
Смотрите также
- Все
- Вымпел
- Голова и плечи
- Двойная вершина
- Прямоугольник
- Треугольник
- Тройная вершина
- Флаг
- Все
- #AAPL
- #AMZN
- #Bitcoin
- #EBAY
- #FB
- #GOOG
- #INTC
- #KO
- #MA
- #MCD
- #MSFT
- #NTDOY
- #PEP
- #TSLA
- #TWTR
- AUDCAD
- AUDCHF
- AUDJPY
- AUDUSD
- EURCAD
- EURCHF
- EURGBP
- EURJPY
- EURNZD
- EURRUB
- EURUSD
- GBPAUD
- GBPCHF
- GBPJPY
- GBPUSD
- GOLD
- NZDCAD
- NZDCHF
- NZDJPY
- NZDUSD
- SILVER
- USDCAD
- USDCHF
- USDJPY
- USDRUB
- Все
- M5
- M15
- M30
- H1
- D1
- Все
- Покупка
- Продажа
- Все
- 1
- 2
- 3
- 4
- 5
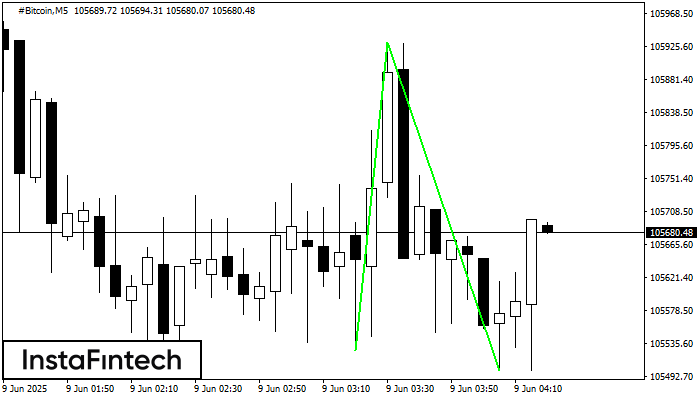
The Double Bottom pattern has been formed on #Bitcoin M5. This formation signals a reversal of the trend from downwards to upwards. The signal is that a buy trade should
The M5 and M15 time frames may have more false entry points.
Open chart in a new window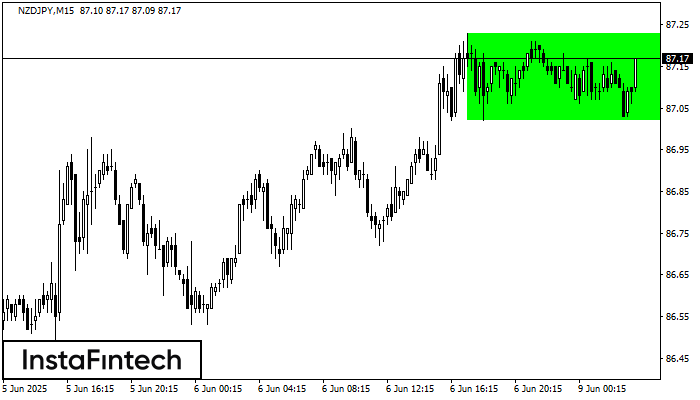
According to the chart of M15, NZDJPY formed the Bullish Rectangle. The pattern indicates a trend continuation. The upper border is 87.23, the lower border is 87.02. The signal means
The M5 and M15 time frames may have more false entry points.
Open chart in a new window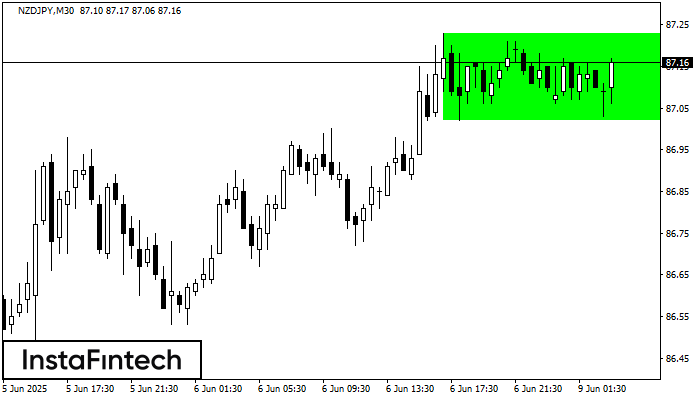
According to the chart of M30, NZDJPY formed the Bullish Rectangle which is a pattern of a trend continuation. The pattern is contained within the following borders: the lower border
Open chart in a new window