


signal strength 1 of 5

According to the chart of M5, #Bitcoin formed the Bullish Rectangle which is a pattern of a trend continuation. The pattern is contained within the following borders: the lower border 87098.24 – 87098.24 and upper border 87617.56 – 87617.56. In case the upper border is broken, the instrument is likely to follow the upward trend.
The M5 and M15 time frames may have more false entry points.
See Also
- All
- Double Top
- Flag
- Head and Shoulders
- Pennant
- Rectangle
- Triangle
- Triple top
- All
- #AAPL
- #AMZN
- #Bitcoin
- #EBAY
- #FB
- #GOOG
- #INTC
- #KO
- #MA
- #MCD
- #MSFT
- #NTDOY
- #PEP
- #TSLA
- #TWTR
- AUDCAD
- AUDCHF
- AUDJPY
- AUDUSD
- EURCAD
- EURCHF
- EURGBP
- EURJPY
- EURNZD
- EURRUB
- EURUSD
- GBPAUD
- GBPCHF
- GBPJPY
- GBPUSD
- GOLD
- NZDCAD
- NZDCHF
- NZDJPY
- NZDUSD
- SILVER
- USDCAD
- USDCHF
- USDJPY
- USDRUB
- All
- M5
- M15
- M30
- H1
- D1
- All
- Buy
- Sale
- All
- 1
- 2
- 3
- 4
- 5
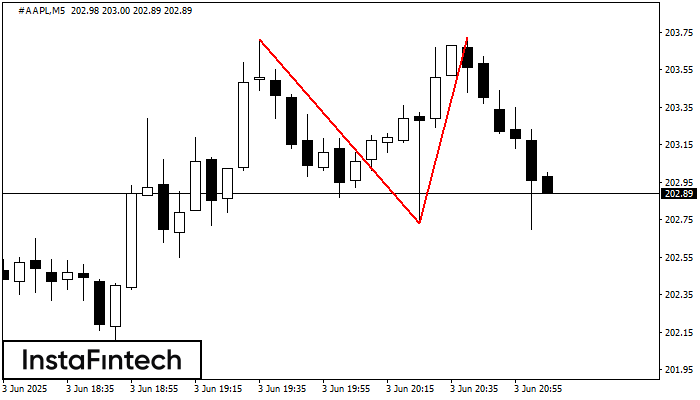
The Double Top pattern has been formed on #AAPL M5. It signals that the trend has been changed from upwards to downwards. Probably, if the base of the pattern 202.73
The M5 and M15 time frames may have more false entry points.
Open chart in a new window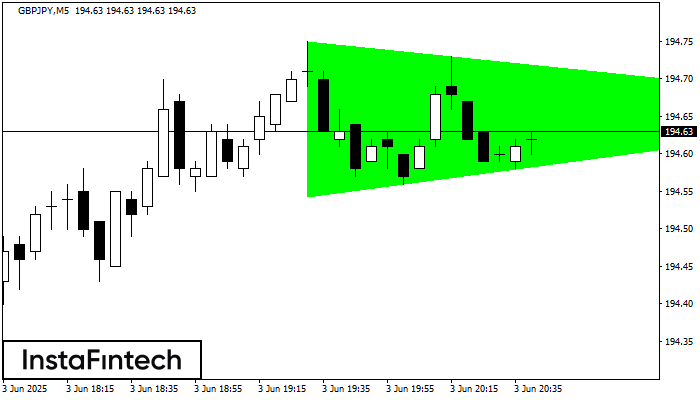
According to the chart of M5, GBPJPY formed the Bullish Symmetrical Triangle pattern. The lower border of the pattern touches the coordinates 194.54/194.66 whereas the upper border goes across 194.75/194.66
The M5 and M15 time frames may have more false entry points.
Open chart in a new window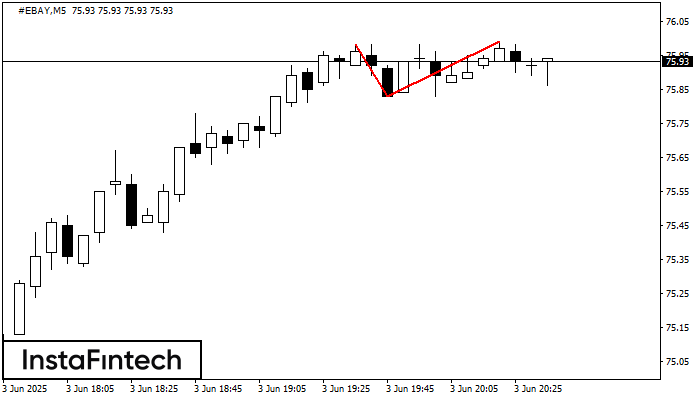
The Double Top pattern has been formed on #EBAY M5. It signals that the trend has been changed from upwards to downwards. Probably, if the base of the pattern 75.83
The M5 and M15 time frames may have more false entry points.
Open chart in a new window


