


signal strength 2 of 5
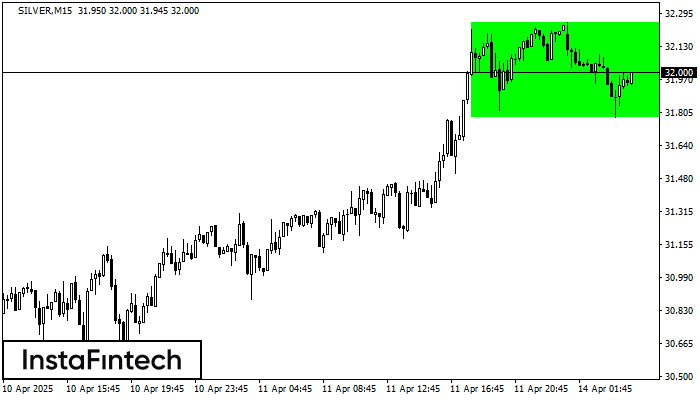
According to the chart of M15, SILVER formed the Bullish Rectangle. This type of a pattern indicates a trend continuation. It consists of two levels: resistance 32.25 and support 31.78. In case the resistance level 32.25 - 32.25 is broken, the instrument is likely to follow the bullish trend.
The M5 and M15 time frames may have more false entry points.
- All
- Double Top
- Flag
- Head and Shoulders
- Pennant
- Rectangle
- Triangle
- Triple top
- All
- #AAPL
- #AMZN
- #Bitcoin
- #EBAY
- #FB
- #GOOG
- #INTC
- #KO
- #MA
- #MCD
- #MSFT
- #NTDOY
- #PEP
- #TSLA
- #TWTR
- AUDCAD
- AUDCHF
- AUDJPY
- AUDUSD
- EURCAD
- EURCHF
- EURGBP
- EURJPY
- EURNZD
- EURRUB
- EURUSD
- GBPAUD
- GBPCHF
- GBPJPY
- GBPUSD
- GOLD
- NZDCAD
- NZDCHF
- NZDJPY
- NZDUSD
- SILVER
- USDCAD
- USDCHF
- USDJPY
- USDRUB
- All
- M5
- M15
- M30
- H1
- D1
- All
- Buy
- Sale
- All
- 1
- 2
- 3
- 4
- 5
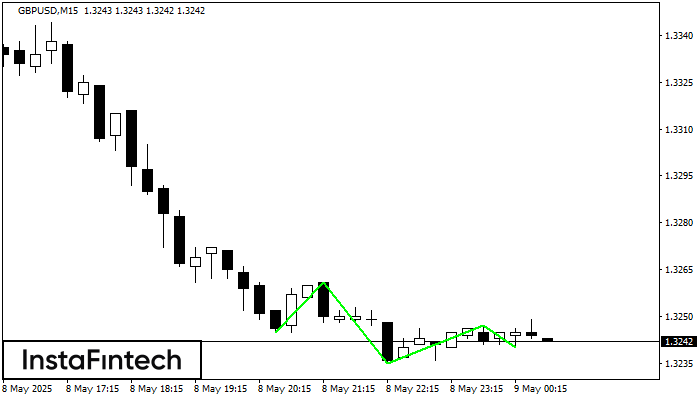
The Triple Bottom pattern has formed on the chart of GBPUSD M15. Features of the pattern: The lower line of the pattern has coordinates 1.3261 with the upper limit 1.3261/1.3247
The M5 and M15 time frames may have more false entry points.
Open chart in a new window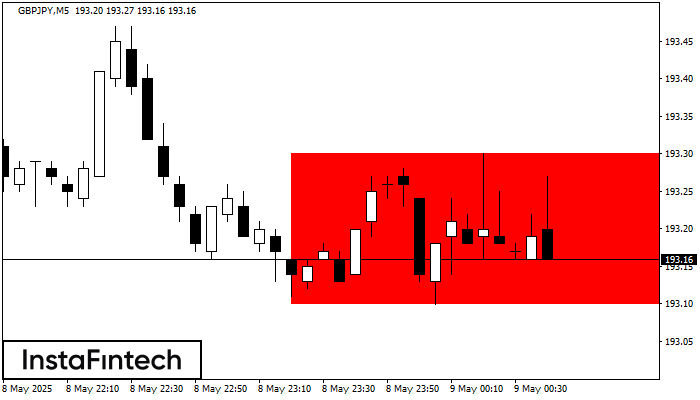
According to the chart of M5, GBPJPY formed the Bearish Rectangle. The pattern indicates a trend continuation. The upper border is 193.30, the lower border is 193.10. The signal means
The M5 and M15 time frames may have more false entry points.
Open chart in a new window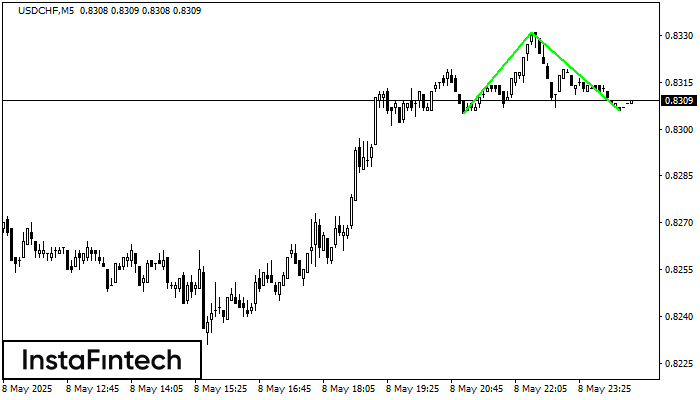
The Double Bottom pattern has been formed on USDCHF M5; the upper boundary is 0.8331; the lower boundary is 0.8306. The width of the pattern is 26 points. In case
The M5 and M15 time frames may have more false entry points.
Open chart in a new window


