

signal strength 1 of 5
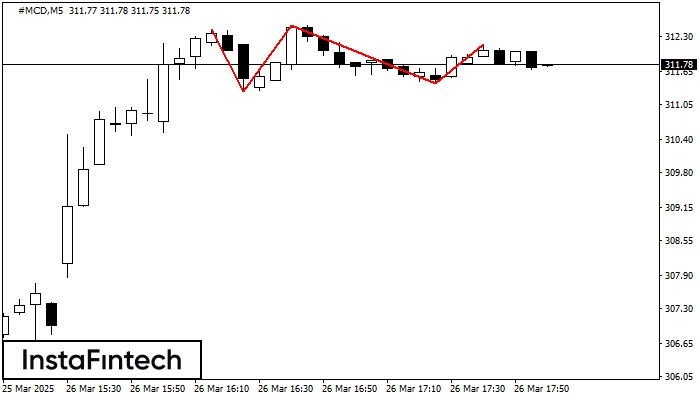
On the chart of the #MCD M5 trading instrument, the Triple Top pattern that signals a trend change has formed. It is possible that after formation of the third peak, the price will try to break through the resistance level 311.29, where we advise to open a trading position for sale. Take profit is the projection of the pattern’s width, which is 115 points.
The M5 and M15 time frames may have more false entry points.
- All
- Double Top
- Flag
- Head and Shoulders
- Pennant
- Rectangle
- Triangle
- Triple top
- All
- #AAPL
- #AMZN
- #Bitcoin
- #EBAY
- #FB
- #GOOG
- #INTC
- #KO
- #MA
- #MCD
- #MSFT
- #NTDOY
- #PEP
- #TSLA
- #TWTR
- AUDCAD
- AUDCHF
- AUDJPY
- AUDUSD
- EURCAD
- EURCHF
- EURGBP
- EURJPY
- EURNZD
- EURRUB
- EURUSD
- GBPAUD
- GBPCHF
- GBPJPY
- GBPUSD
- GOLD
- NZDCAD
- NZDCHF
- NZDJPY
- NZDUSD
- SILVER
- USDCAD
- USDCHF
- USDJPY
- USDRUB
- All
- M5
- M15
- M30
- H1
- D1
- All
- Buy
- Sale
- All
- 1
- 2
- 3
- 4
- 5
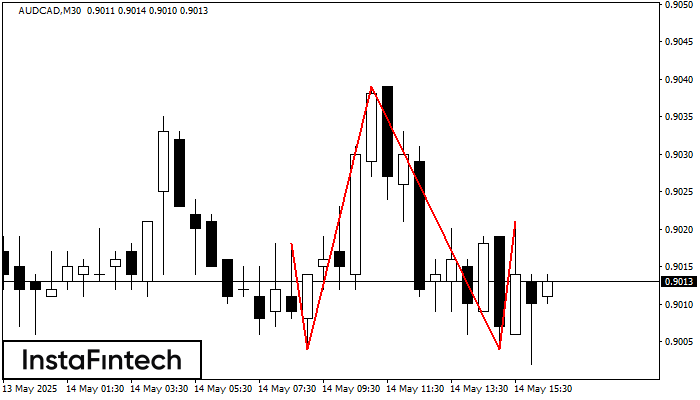
AUDCAD M30 membentuk corak Head dan Shoulders dengan ciri-ciri berikut: Bahagian atas Head adalah 0.9039, garisan Neck dan sudut menaik berada pada 0.9004/0.9004. Pembentukan corak ini boleh membawa perubahan dalam
Open chart in a new window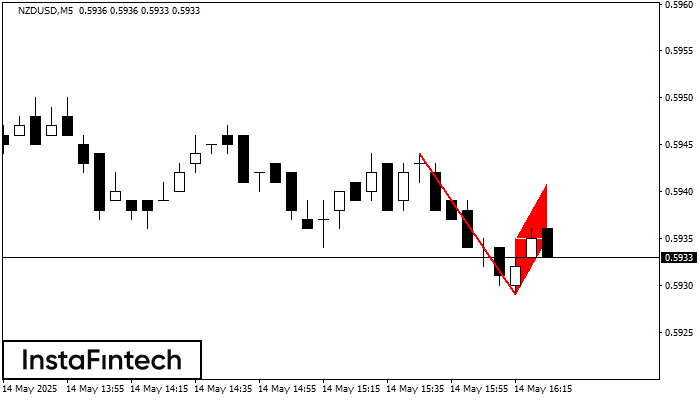
Corak Flag Aliran Menurun telah dibentuk pada carta NZDUSD M5. Oleh demikian, aliran menurun mungkin akan berterusan dalam tempoh terdekat. Sebaik sahaja harga menembusi di bawah yang rendah pada 0.5929
Carta masa M5 dan M15 mungkin mempunyai lebih banyak titik kemasukan palsu.
Open chart in a new window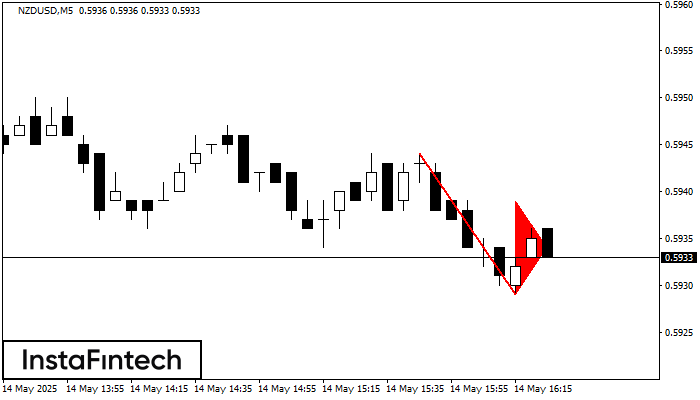
Corak Pennant Aliran Menurun telah dibentuk pada carta NZDUSD M5. Corak menandakan kesinambungan aliran menurun sekiranya aliran pennant rendah 0.5929 ditembusi. Cadangan: Meletakkan pesanan penanguhan sell stop
Carta masa M5 dan M15 mungkin mempunyai lebih banyak titik kemasukan palsu.
Open chart in a new window


