


signal strength 2 of 5
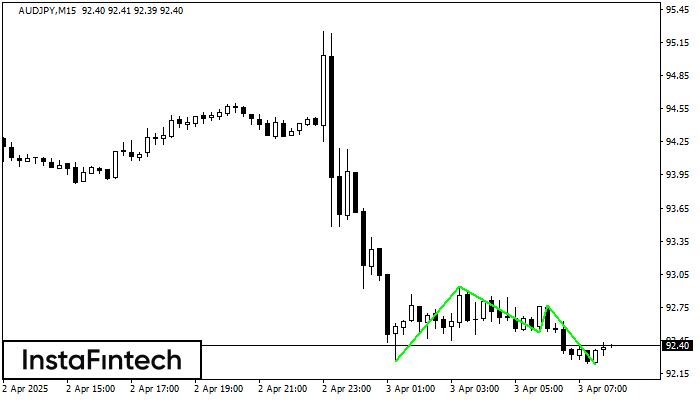
The Triple Bottom pattern has been formed on AUDJPY M15. It has the following characteristics: resistance level 92.94/92.77; support level 92.26/92.23; the width is 68 points. In the event of a breakdown of the resistance level of 92.94, the price is likely to continue an upward movement at least to 92.75.
The M5 and M15 time frames may have more false entry points.
See Also
- All
- Double Top
- Flag
- Head and Shoulders
- Pennant
- Rectangle
- Triangle
- Triple top
- All
- #AAPL
- #AMZN
- #Bitcoin
- #EBAY
- #FB
- #GOOG
- #INTC
- #KO
- #MA
- #MCD
- #MSFT
- #NTDOY
- #PEP
- #TSLA
- #TWTR
- AUDCAD
- AUDCHF
- AUDJPY
- AUDUSD
- EURCAD
- EURCHF
- EURGBP
- EURJPY
- EURNZD
- EURRUB
- EURUSD
- GBPAUD
- GBPCHF
- GBPJPY
- GBPUSD
- GOLD
- NZDCAD
- NZDCHF
- NZDJPY
- NZDUSD
- SILVER
- USDCAD
- USDCHF
- USDJPY
- USDRUB
- All
- M5
- M15
- M30
- H1
- D1
- All
- Buy
- Sale
- All
- 1
- 2
- 3
- 4
- 5
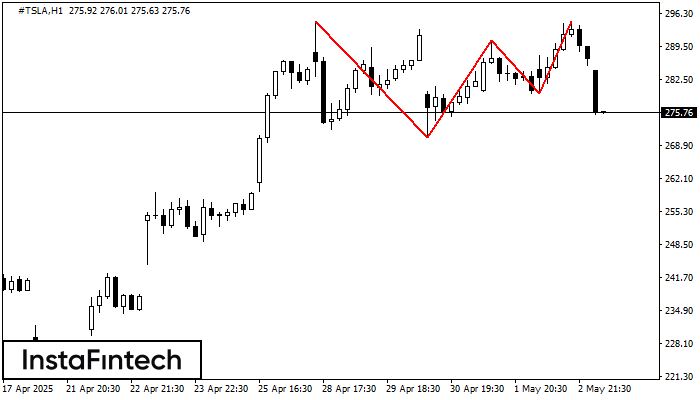
The Triple Top pattern has formed on the chart of the #TSLA H1. Features of the pattern: borders have an ascending angle; the lower line of the pattern
Open chart in a new window
The Triple Top pattern has formed on the chart of the #TSLA H1. Features of the pattern: borders have an ascending angle; the lower line of the pattern
Open chart in a new window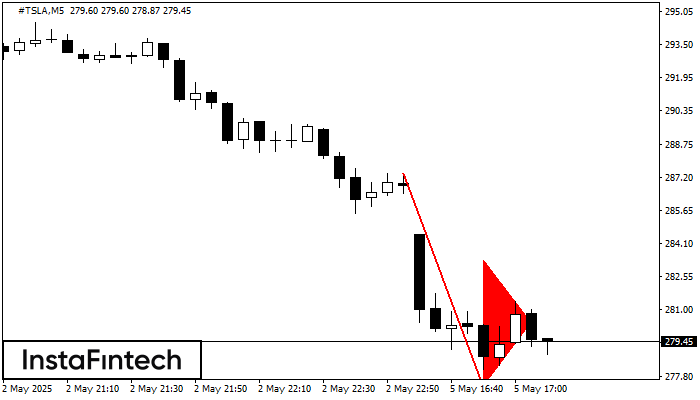
The Bearish pennant pattern has formed on the #TSLA M5 chart. It signals potential continuation of the existing trend. Specifications: the pattern’s bottom has the coordinate of 277.36; the projection
The M5 and M15 time frames may have more false entry points.
Open chart in a new window


