

signal strength 4 of 5
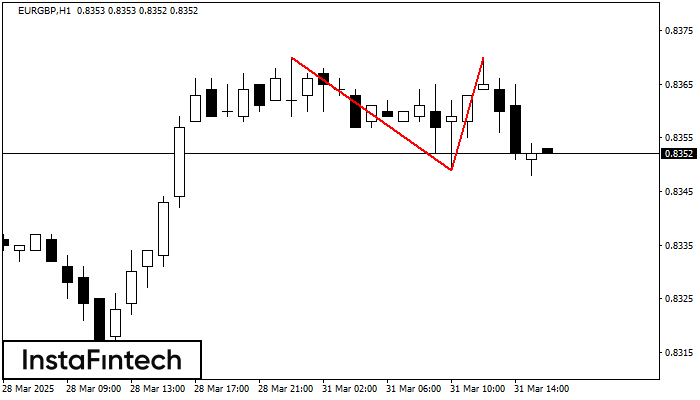
On the chart of EURGBP H1 the Double Top reversal pattern has been formed. Characteristics: the upper boundary 0.8370; the lower boundary 0.8349; the width of the pattern 21 points. The signal: a break of the lower boundary will cause continuation of the downward trend targeting the 0.8309 level.
See Also
- All
- Double Top
- Flag
- Head and Shoulders
- Pennant
- Rectangle
- Triangle
- Triple top
- All
- #AAPL
- #AMZN
- #Bitcoin
- #EBAY
- #FB
- #GOOG
- #INTC
- #KO
- #MA
- #MCD
- #MSFT
- #NTDOY
- #PEP
- #TSLA
- #TWTR
- AUDCAD
- AUDCHF
- AUDJPY
- AUDUSD
- EURCAD
- EURCHF
- EURGBP
- EURJPY
- EURNZD
- EURRUB
- EURUSD
- GBPAUD
- GBPCHF
- GBPJPY
- GBPUSD
- GOLD
- NZDCAD
- NZDCHF
- NZDJPY
- NZDUSD
- SILVER
- USDCAD
- USDCHF
- USDJPY
- USDRUB
- All
- M5
- M15
- M30
- H1
- D1
- All
- Buy
- Sale
- All
- 1
- 2
- 3
- 4
- 5
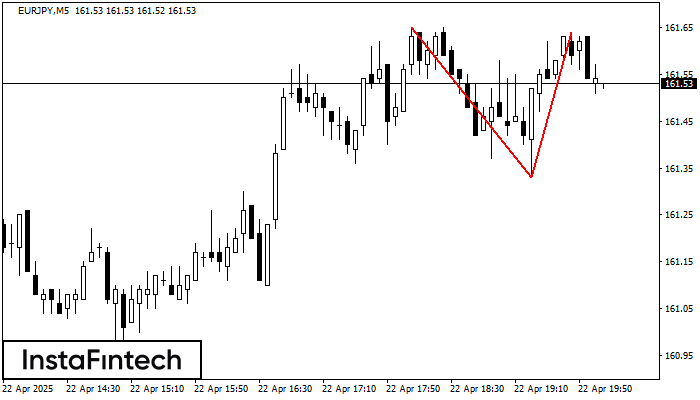
The Double Top pattern has been formed on EURJPY M5. It signals that the trend has been changed from upwards to downwards. Probably, if the base of the pattern 161.33
The M5 and M15 time frames may have more false entry points.
Open chart in a new window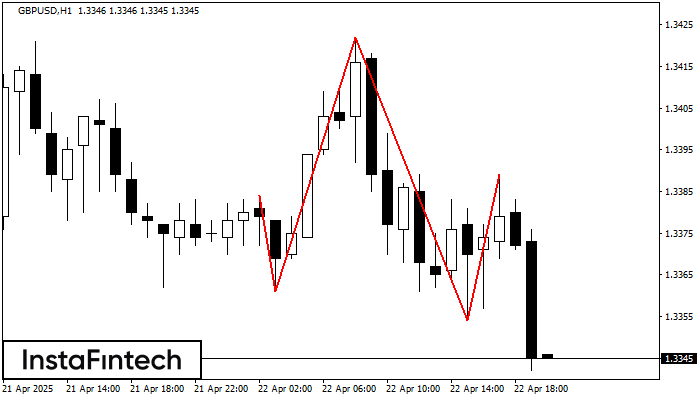
The GBPUSD H1 formed the Head and Shoulders pattern with the following features: The Head’s top is at 1.3422, the Neckline and the upward angle are at 1.3361/1.3354. The formation
Open chart in a new window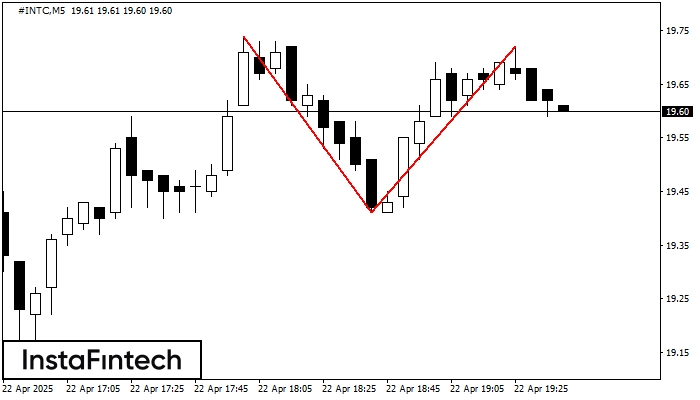
On the chart of #INTC M5 the Double Top reversal pattern has been formed. Characteristics: the upper boundary 19.72; the lower boundary 19.41; the width of the pattern 31 points
The M5 and M15 time frames may have more false entry points.
Open chart in a new window


