

signal strength 2 of 5
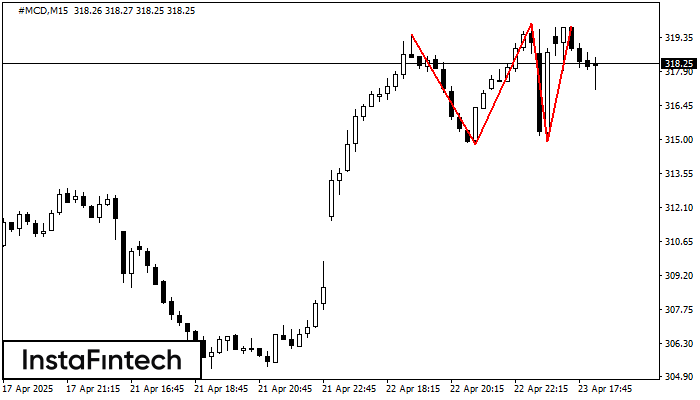
The Triple Top pattern has formed on the chart of the #MCD M15 trading instrument. It is a reversal pattern featuring the following characteristics: resistance level -33, support level -14, and pattern’s width 469. Forecast If the price breaks through the support level 314.80, it is likely to move further down to 319.74.
The M5 and M15 time frames may have more false entry points.
See Also
- All
- Double Top
- Flag
- Head and Shoulders
- Pennant
- Rectangle
- Triangle
- Triple top
- All
- #AAPL
- #AMZN
- #Bitcoin
- #EBAY
- #FB
- #GOOG
- #INTC
- #KO
- #MA
- #MCD
- #MSFT
- #NTDOY
- #PEP
- #TSLA
- #TWTR
- AUDCAD
- AUDCHF
- AUDJPY
- AUDUSD
- EURCAD
- EURCHF
- EURGBP
- EURJPY
- EURNZD
- EURRUB
- EURUSD
- GBPAUD
- GBPCHF
- GBPJPY
- GBPUSD
- GOLD
- NZDCAD
- NZDCHF
- NZDJPY
- NZDUSD
- SILVER
- USDCAD
- USDCHF
- USDJPY
- USDRUB
- All
- M5
- M15
- M30
- H1
- D1
- All
- Buy
- Sale
- All
- 1
- 2
- 3
- 4
- 5

The Double Top reversal pattern has been formed on #Bitcoin M30. Characteristics: the upper boundary 105283.16; the lower boundary 103816.55; the width of the pattern is 147353 points. Sell trades
Open chart in a new window
On the chart of USDCAD M15 the Double Top reversal pattern has been formed. Characteristics: the upper boundary 1.3702; the lower boundary 1.3668; the width of the pattern 34 points
The M5 and M15 time frames may have more false entry points.
Open chart in a new window
According to the chart of M15, AUDJPY formed the Bullish Symmetrical Triangle pattern. The lower border of the pattern touches the coordinates 93.96/94.02 whereas the upper border goes across 94.07/94.02
The M5 and M15 time frames may have more false entry points.
Open chart in a new window


