

signal strength 1 of 5
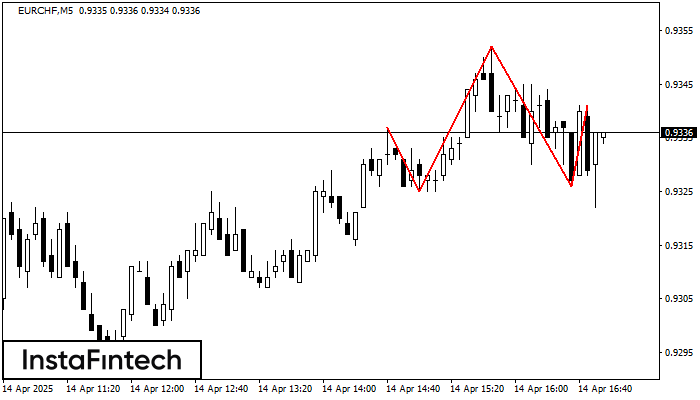
The technical pattern called Head and Shoulders has appeared on the chart of EURCHF M5. There are weighty reasons to suggest that the price will surpass the Neckline 0.9325/0.9326 after the right shoulder has been formed. So, the trend is set to change with the price heading for 0.9311.
The M5 and M15 time frames may have more false entry points.
See Also
- All
- Double Top
- Flag
- Head and Shoulders
- Pennant
- Rectangle
- Triangle
- Triple top
- All
- #AAPL
- #AMZN
- #Bitcoin
- #EBAY
- #FB
- #GOOG
- #INTC
- #KO
- #MA
- #MCD
- #MSFT
- #NTDOY
- #PEP
- #TSLA
- #TWTR
- AUDCAD
- AUDCHF
- AUDJPY
- AUDUSD
- EURCAD
- EURCHF
- EURGBP
- EURJPY
- EURNZD
- EURRUB
- EURUSD
- GBPAUD
- GBPCHF
- GBPJPY
- GBPUSD
- GOLD
- NZDCAD
- NZDCHF
- NZDJPY
- NZDUSD
- SILVER
- USDCAD
- USDCHF
- USDJPY
- USDRUB
- All
- M5
- M15
- M30
- H1
- D1
- All
- Buy
- Sale
- All
- 1
- 2
- 3
- 4
- 5
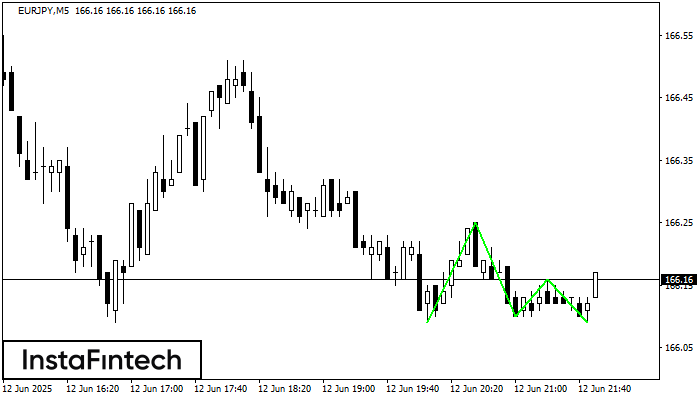
The Triple Bottom pattern has been formed on EURJPY M5. It has the following characteristics: resistance level 166.25/166.16; support level 166.09/166.09; the width is 16 points. In the event
The M5 and M15 time frames may have more false entry points.
Open chart in a new window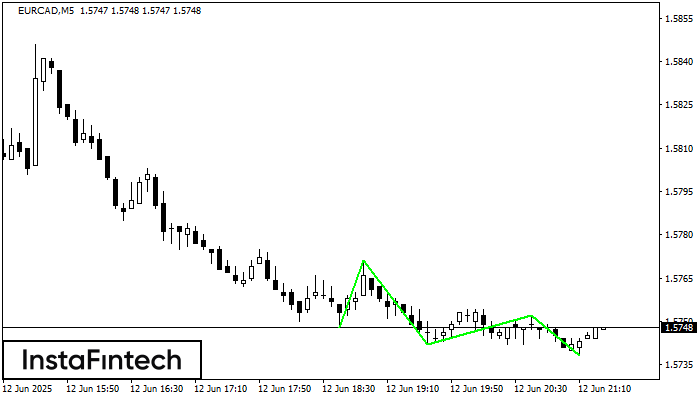
The Triple Bottom pattern has been formed on EURCAD M5. It has the following characteristics: resistance level 1.5771/1.5752; support level 1.5748/1.5738; the width is 23 points. In the event
The M5 and M15 time frames may have more false entry points.
Open chart in a new window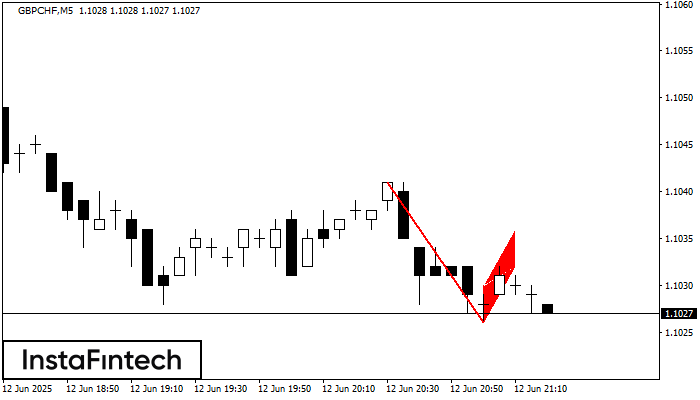
The Bearish Flag pattern has been formed on GBPCHF at M5. The lower boundary of the pattern is located at 1.1026/1.1032 while the upper boundary lies at 1.1030/1.1036. The projection
The M5 and M15 time frames may have more false entry points.
Open chart in a new window


