

signal strength 1 of 5
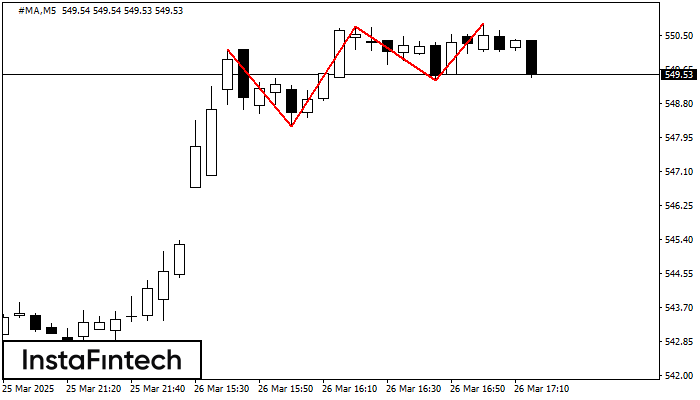
The Triple Top pattern has formed on the chart of the #MA M5 trading instrument. It is a reversal pattern featuring the following characteristics: resistance level -66, support level -113, and pattern’s width 192. Forecast If the price breaks through the support level 548.24, it is likely to move further down to 550.59.
The M5 and M15 time frames may have more false entry points.
See Also
- All
- Double Top
- Flag
- Head and Shoulders
- Pennant
- Rectangle
- Triangle
- Triple top
- All
- #AAPL
- #AMZN
- #Bitcoin
- #EBAY
- #FB
- #GOOG
- #INTC
- #KO
- #MA
- #MCD
- #MSFT
- #NTDOY
- #PEP
- #TSLA
- #TWTR
- AUDCAD
- AUDCHF
- AUDJPY
- AUDUSD
- EURCAD
- EURCHF
- EURGBP
- EURJPY
- EURNZD
- EURRUB
- EURUSD
- GBPAUD
- GBPCHF
- GBPJPY
- GBPUSD
- GOLD
- NZDCAD
- NZDCHF
- NZDJPY
- NZDUSD
- SILVER
- USDCAD
- USDCHF
- USDJPY
- USDRUB
- All
- M5
- M15
- M30
- H1
- D1
- All
- Buy
- Sale
- All
- 1
- 2
- 3
- 4
- 5
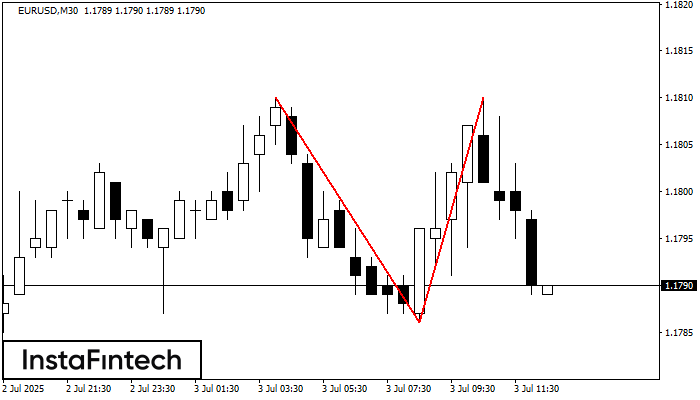
The Double Top reversal pattern has been formed on EURUSD M30. Characteristics: the upper boundary 1.1810; the lower boundary 1.1786; the width of the pattern is 24 points. Sell trades
Open chart in a new window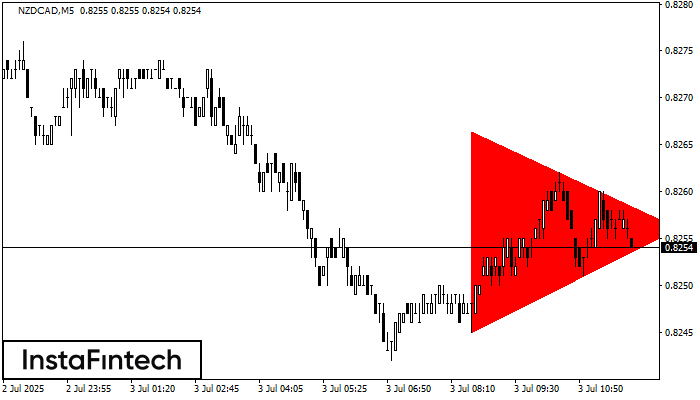
According to the chart of M5, NZDCAD formed the Bearish Symmetrical Triangle pattern. Trading recommendations: A breach of the lower border 0.8245 is likely to encourage a continuation
The M5 and M15 time frames may have more false entry points.
Open chart in a new window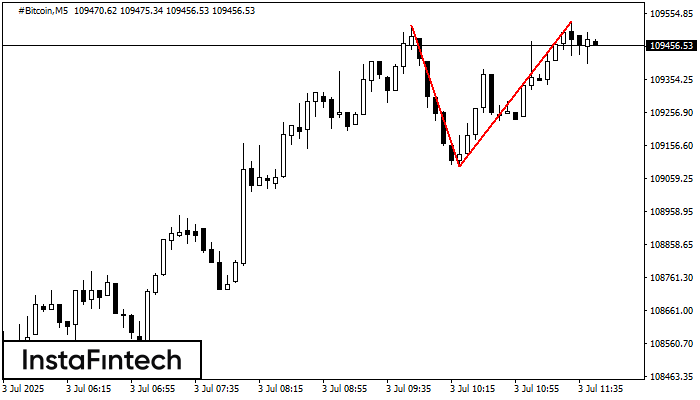
On the chart of #Bitcoin M5 the Double Top reversal pattern has been formed. Characteristics: the upper boundary 109530.33; the lower boundary 109092.64; the width of the pattern 43769 points
The M5 and M15 time frames may have more false entry points.
Open chart in a new window


