

signal strength 2 of 5

The Triple Bottom pattern has been formed on #AAPL M15. It has the following characteristics: resistance level 191.73/191.10; support level 189.80/190.18; the width is 193 points. In the event of a breakdown of the resistance level of 191.73, the price is likely to continue an upward movement at least to 190.34.
The M5 and M15 time frames may have more false entry points.
- All
- Double Top
- Flag
- Head and Shoulders
- Pennant
- Rectangle
- Triangle
- Triple top
- All
- #AAPL
- #AMZN
- #Bitcoin
- #EBAY
- #FB
- #GOOG
- #INTC
- #KO
- #MA
- #MCD
- #MSFT
- #NTDOY
- #PEP
- #TSLA
- #TWTR
- AUDCAD
- AUDCHF
- AUDJPY
- AUDUSD
- EURCAD
- EURCHF
- EURGBP
- EURJPY
- EURNZD
- EURRUB
- EURUSD
- GBPAUD
- GBPCHF
- GBPJPY
- GBPUSD
- GOLD
- NZDCAD
- NZDCHF
- NZDJPY
- NZDUSD
- SILVER
- USDCAD
- USDCHF
- USDJPY
- USDRUB
- All
- M5
- M15
- M30
- H1
- D1
- All
- Buy
- Sale
- All
- 1
- 2
- 3
- 4
- 5
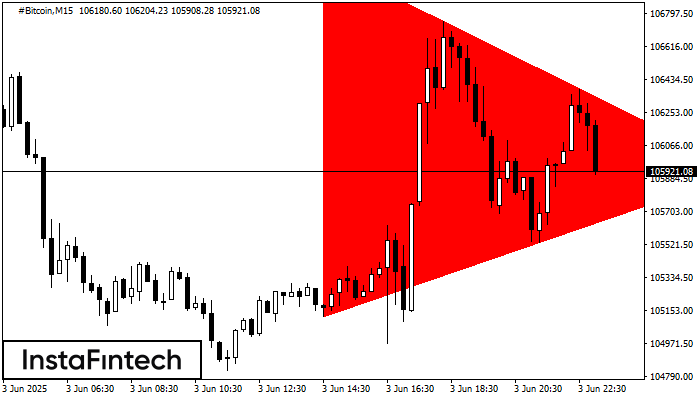
According to the chart of M15, #Bitcoin formed the Bearish Symmetrical Triangle pattern. Description: The lower border is 105120.25/105921.53 and upper border is 107085.82/105921.53. The pattern width is measured
The M5 and M15 time frames may have more false entry points.
Open chart in a new window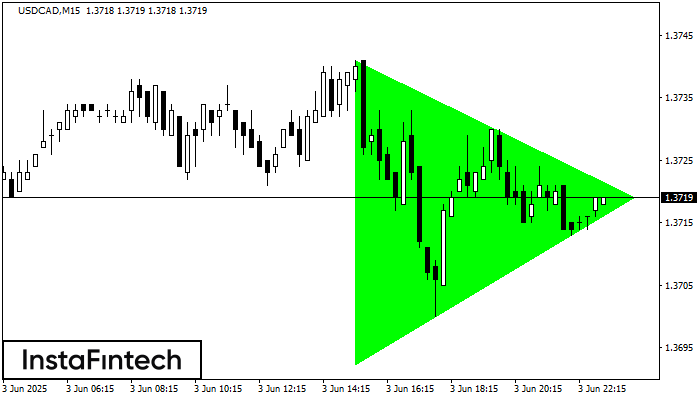
According to the chart of M15, USDCAD formed the Bullish Symmetrical Triangle pattern. Description: This is the pattern of a trend continuation. 1.3741 and 1.3692 are the coordinates
The M5 and M15 time frames may have more false entry points.
Open chart in a new window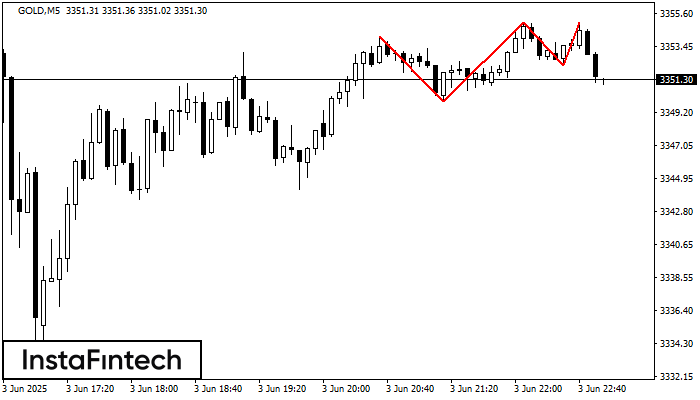
On the chart of the GOLD M5 trading instrument, the Triple Top pattern that signals a trend change has formed. It is possible that after formation of the third peak
The M5 and M15 time frames may have more false entry points.
Open chart in a new window


