


signal strength 4 of 5
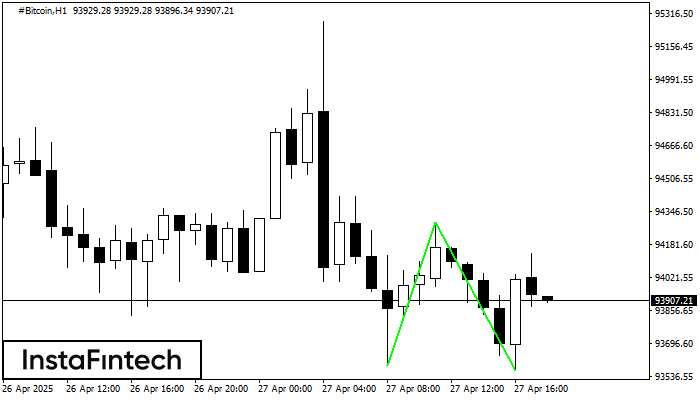
The Double Bottom pattern has been formed on #Bitcoin H1. This formation signals a reversal of the trend from downwards to upwards. The signal is that a buy trade should be opened after the upper boundary of the pattern 94291.97 is broken. The further movements will rely on the width of the current pattern 70503 points.
See Also
- All
- Double Top
- Flag
- Head and Shoulders
- Pennant
- Rectangle
- Triangle
- Triple top
- All
- #AAPL
- #AMZN
- #Bitcoin
- #EBAY
- #FB
- #GOOG
- #INTC
- #KO
- #MA
- #MCD
- #MSFT
- #NTDOY
- #PEP
- #TSLA
- #TWTR
- AUDCAD
- AUDCHF
- AUDJPY
- AUDUSD
- EURCAD
- EURCHF
- EURGBP
- EURJPY
- EURNZD
- EURRUB
- EURUSD
- GBPAUD
- GBPCHF
- GBPJPY
- GBPUSD
- GOLD
- NZDCAD
- NZDCHF
- NZDJPY
- NZDUSD
- SILVER
- USDCAD
- USDCHF
- USDJPY
- USDRUB
- All
- M5
- M15
- M30
- H1
- D1
- All
- Buy
- Sale
- All
- 1
- 2
- 3
- 4
- 5
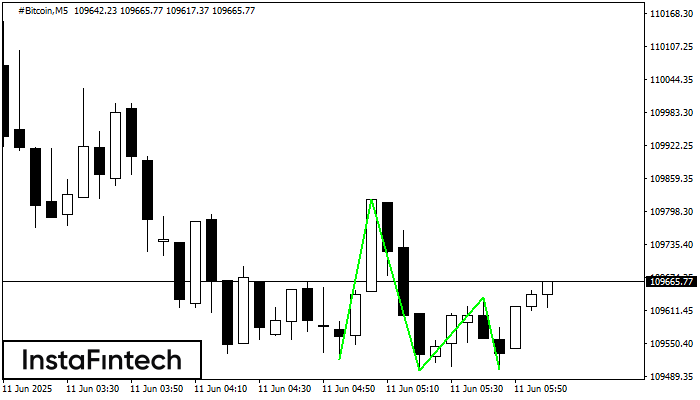
The Triple Bottom pattern has been formed on #Bitcoin M5. It has the following characteristics: resistance level 109821.12/109636.18; support level 109521.27/109502.23; the width is 29985 points. In the event
The M5 and M15 time frames may have more false entry points.
Open chart in a new window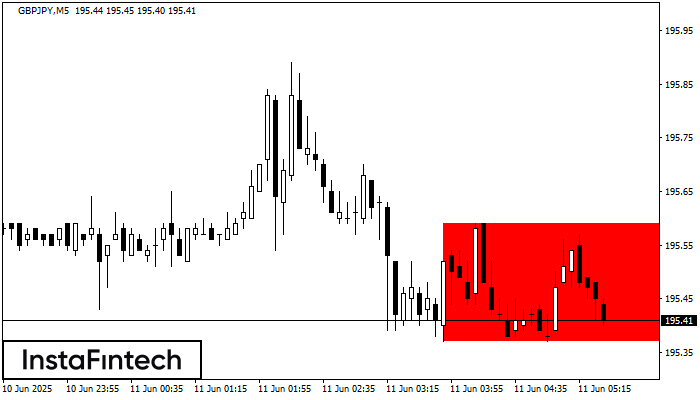
According to the chart of M5, GBPJPY formed the Bearish Rectangle. This type of a pattern indicates a trend continuation. It consists of two levels: resistance 195.59 - 0.00
The M5 and M15 time frames may have more false entry points.
Open chart in a new window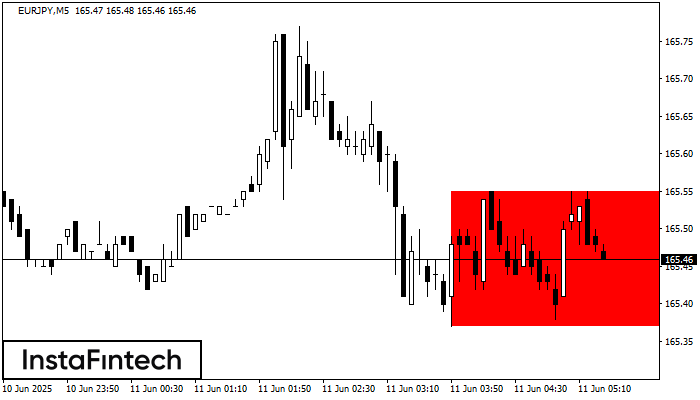
According to the chart of M5, EURJPY formed the Bearish Rectangle. This type of a pattern indicates a trend continuation. It consists of two levels: resistance 165.55 - 0.00
The M5 and M15 time frames may have more false entry points.
Open chart in a new window


