

signal strength 1 of 5
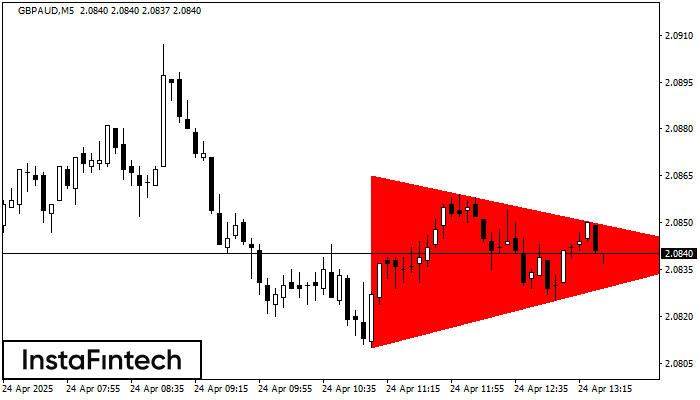
According to the chart of M5, GBPAUD formed the Bearish Symmetrical Triangle pattern. Trading recommendations: A breach of the lower border 2.0810 is likely to encourage a continuation of the downward trend.
The M5 and M15 time frames may have more false entry points.
See Also
- All
- Double Top
- Flag
- Head and Shoulders
- Pennant
- Rectangle
- Triangle
- Triple top
- All
- #AAPL
- #AMZN
- #Bitcoin
- #EBAY
- #FB
- #GOOG
- #INTC
- #KO
- #MA
- #MCD
- #MSFT
- #NTDOY
- #PEP
- #TSLA
- #TWTR
- AUDCAD
- AUDCHF
- AUDJPY
- AUDUSD
- EURCAD
- EURCHF
- EURGBP
- EURJPY
- EURNZD
- EURRUB
- EURUSD
- GBPAUD
- GBPCHF
- GBPJPY
- GBPUSD
- GOLD
- NZDCAD
- NZDCHF
- NZDJPY
- NZDUSD
- SILVER
- USDCAD
- USDCHF
- USDJPY
- USDRUB
- All
- M5
- M15
- M30
- H1
- D1
- All
- Buy
- Sale
- All
- 1
- 2
- 3
- 4
- 5
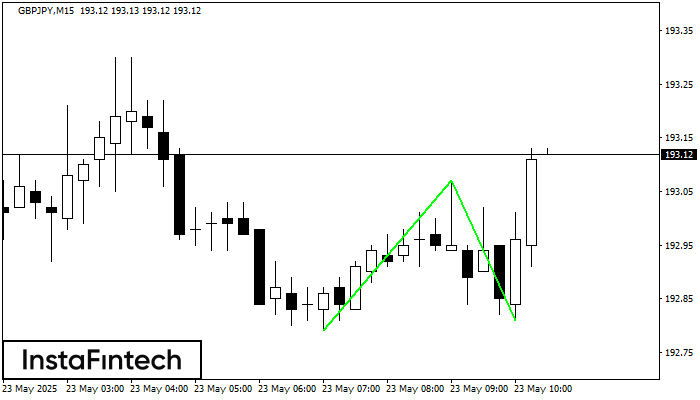
M15 চার্টে, GBPJPY-এর ডাবল বটম প্যাটার্নটি গঠিত হয়েছে। বৈশিষ্ট্য: সাপোর্ট স্তর হচ্ছে 192.79; রেজিস্ট্যান্স স্তর হচ্ছে 193.07; প্যাটার্নের প্রস্থ হচ্ছে 28 পয়েন্ট। রেজিস্ট্যান্স স্তর ভেদ করা হলে, 26 পয়েন্টের দূরত্বে
M5 এবং M15 টাইম ফ্রেমে আরও ভুল এন্ট্রি পয়েন্ট থাকতে পারে।
Open chart in a new window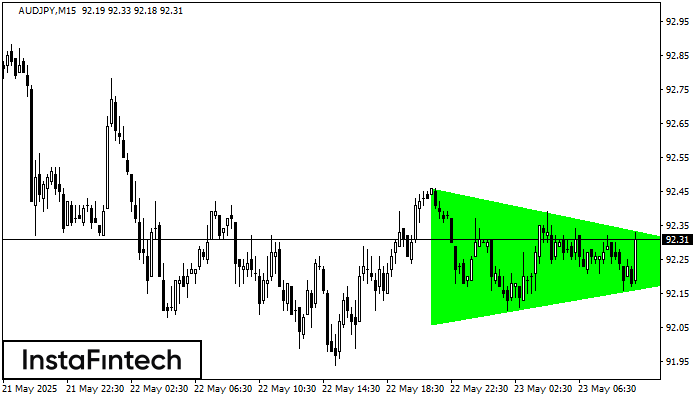
M15 চার্ট অনুসারে, AUDJPY বুলিশ সিমেট্রিকাল ট্রায়াঙ্গেল প্যাটার্ন গঠন করেছে, যা চলমান প্রবণতা অব্যাহত থাকবে বলে ইঙ্গিত দিচ্ছে। বর্ণনা: প্যাটার্নের উপরের সীমানা 92.46/92.24-এর কোঅর্ডিনেটগুলো স্পর্শ করেছে যেখানে নীচের সীমানা 92.06/92.24
M5 এবং M15 টাইম ফ্রেমে আরও ভুল এন্ট্রি পয়েন্ট থাকতে পারে।
Open chart in a new window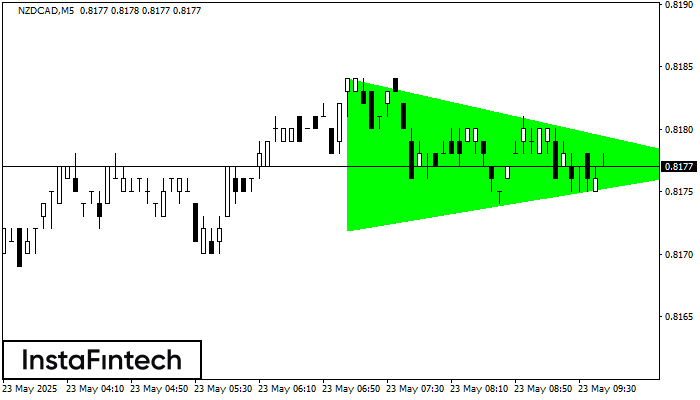
M5 চার্ট অনুসারে, NZDCAD বুলিশ সিমেট্রিকাল ট্রায়াঙ্গেল প্যাটার্ন গঠন করেছে, যা চলমান প্রবণতা অব্যাহত থাকবে বলে ইঙ্গিত দিচ্ছে। বর্ণনা: প্যাটার্নের উপরের সীমানা 0.8184/0.8177-এর কোঅর্ডিনেটগুলো স্পর্শ করেছে যেখানে নীচের সীমানা 0.8172/0.8177
M5 এবং M15 টাইম ফ্রেমে আরও ভুল এন্ট্রি পয়েন্ট থাকতে পারে।
Open chart in a new window


