


signal strength 2 of 5
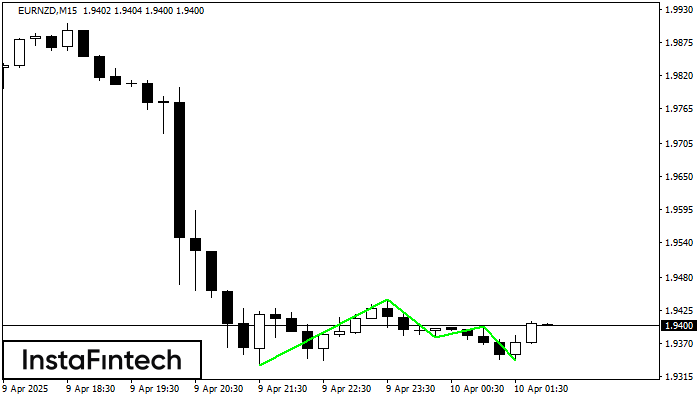
The Triple Bottom pattern has formed on the chart of EURNZD M15. Features of the pattern: The lower line of the pattern has coordinates 1.9443 with the upper limit 1.9443/1.9398, the projection of the width is 110 points. The formation of the Triple Bottom pattern most likely indicates a change in the trend from downward to upward. This means that in the event of a breakdown of the resistance level 1.9333, the price is most likely to continue the upward movement.
The M5 and M15 time frames may have more false entry points.
See Also
- All
- Double Top
- Flag
- Head and Shoulders
- Pennant
- Rectangle
- Triangle
- Triple top
- All
- #AAPL
- #AMZN
- #Bitcoin
- #EBAY
- #FB
- #GOOG
- #INTC
- #KO
- #MA
- #MCD
- #MSFT
- #NTDOY
- #PEP
- #TSLA
- #TWTR
- AUDCAD
- AUDCHF
- AUDJPY
- AUDUSD
- EURCAD
- EURCHF
- EURGBP
- EURJPY
- EURNZD
- EURRUB
- EURUSD
- GBPAUD
- GBPCHF
- GBPJPY
- GBPUSD
- GOLD
- NZDCAD
- NZDCHF
- NZDJPY
- NZDUSD
- SILVER
- USDCAD
- USDCHF
- USDJPY
- USDRUB
- All
- M5
- M15
- M30
- H1
- D1
- All
- Buy
- Sale
- All
- 1
- 2
- 3
- 4
- 5
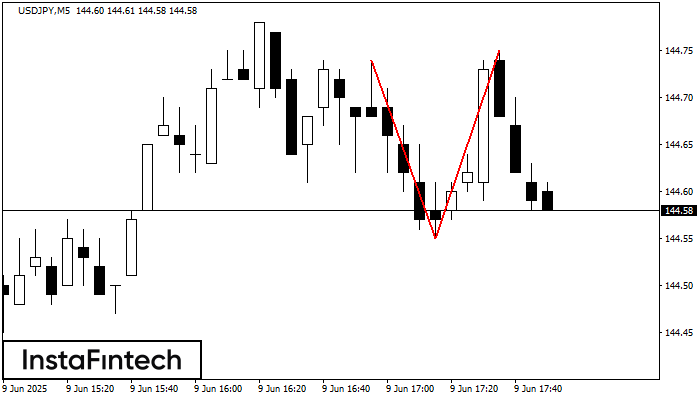
The Double Top reversal pattern has been formed on USDJPY M5. Characteristics: the upper boundary 144.74; the lower boundary 144.55; the width of the pattern is 20 points. Sell trades
The M5 and M15 time frames may have more false entry points.
Open chart in a new window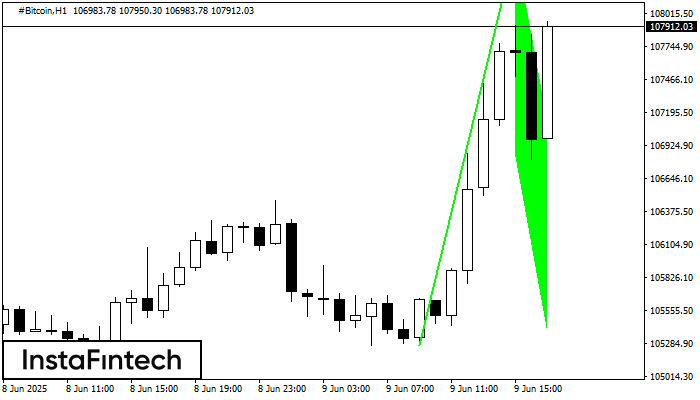
The Bullish Flag pattern which signals continuation of a trend has been formed on the chart #Bitcoin H1. Forecast: if the price breaks above the pattern high at 108563.52, then
Open chart in a new window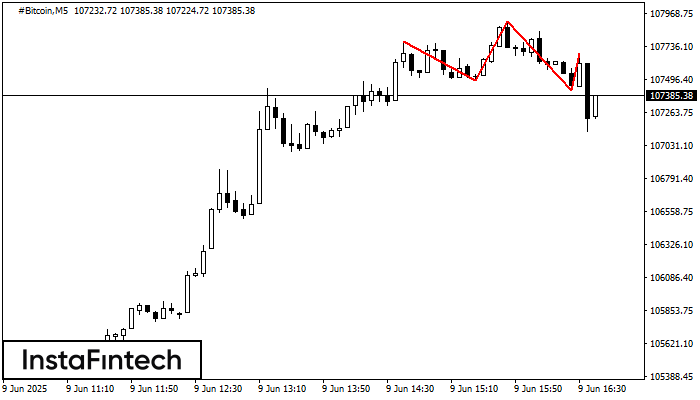
The #Bitcoin M5 formed the Head and Shoulders pattern with the following features: The Head’s top is at 107912.77, the Neckline and the upward angle are at 107491.49/107422.45. The formation
The M5 and M15 time frames may have more false entry points.
Open chart in a new window


