

signal strength 2 of 5
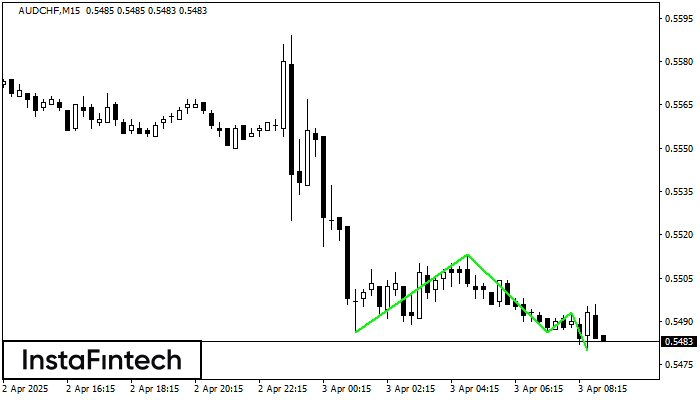
The Triple Bottom pattern has been formed on AUDCHF M15. It has the following characteristics: resistance level 0.5513/0.5493; support level 0.5486/0.5480; the width is 27 points. In the event of a breakdown of the resistance level of 0.5513, the price is likely to continue an upward movement at least to 0.5508.
The M5 and M15 time frames may have more false entry points.
- All
- Double Top
- Flag
- Head and Shoulders
- Pennant
- Rectangle
- Triangle
- Triple top
- All
- #AAPL
- #AMZN
- #Bitcoin
- #EBAY
- #FB
- #GOOG
- #INTC
- #KO
- #MA
- #MCD
- #MSFT
- #NTDOY
- #PEP
- #TSLA
- #TWTR
- AUDCAD
- AUDCHF
- AUDJPY
- AUDUSD
- EURCAD
- EURCHF
- EURGBP
- EURJPY
- EURNZD
- EURRUB
- EURUSD
- GBPAUD
- GBPCHF
- GBPJPY
- GBPUSD
- GOLD
- NZDCAD
- NZDCHF
- NZDJPY
- NZDUSD
- SILVER
- USDCAD
- USDCHF
- USDJPY
- USDRUB
- All
- M5
- M15
- M30
- H1
- D1
- All
- Buy
- Sale
- All
- 1
- 2
- 3
- 4
- 5
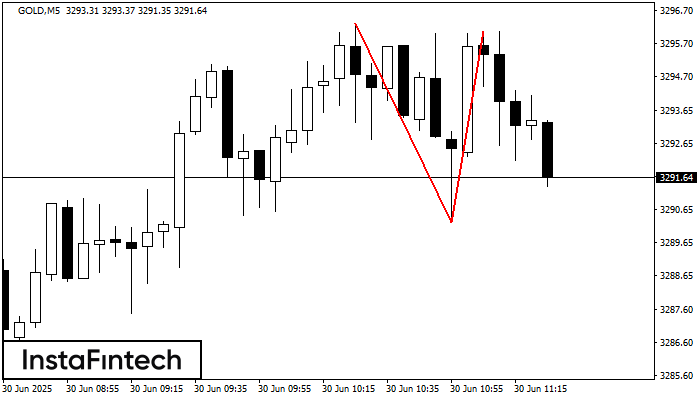
On the chart of GOLD M5 the Double Top reversal pattern has been formed. Characteristics: the upper boundary 3296.07; the lower boundary 3290.26; the width of the pattern 581 points
The M5 and M15 time frames may have more false entry points.
Open chart in a new window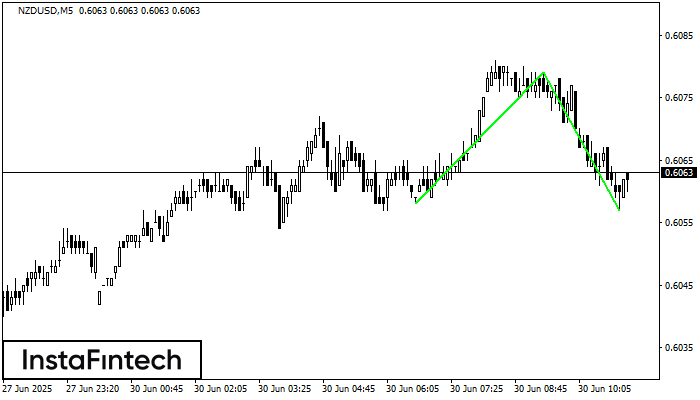
The Double Bottom pattern has been formed on NZDUSD M5. This formation signals a reversal of the trend from downwards to upwards. The signal is that a buy trade should
The M5 and M15 time frames may have more false entry points.
Open chart in a new window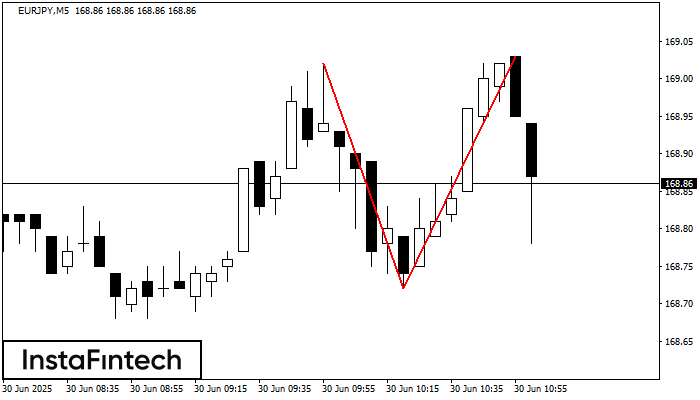
On the chart of EURJPY M5 the Double Top reversal pattern has been formed. Characteristics: the upper boundary 169.03; the lower boundary 168.72; the width of the pattern 31 points
The M5 and M15 time frames may have more false entry points.
Open chart in a new window


