


signal strength 4 of 5
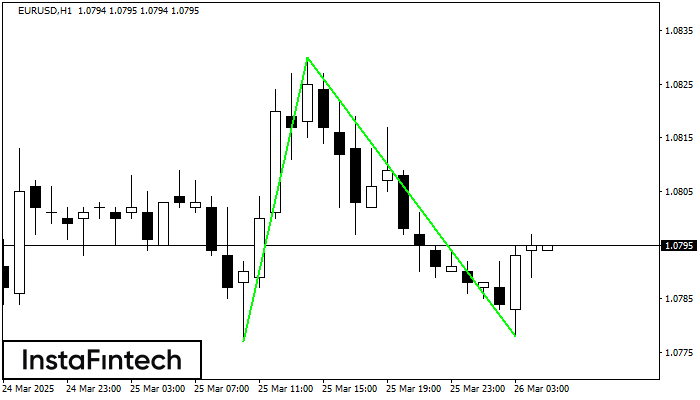
The Double Bottom pattern has been formed on EURUSD H1; the upper boundary is 1.0830; the lower boundary is 1.0778. The width of the pattern is 53 points. In case of a break of the upper boundary 1.0830, a change in the trend can be predicted where the width of the pattern will coincide with the distance to a possible take profit level.
See Also
- All
- Double Top
- Flag
- Head and Shoulders
- Pennant
- Rectangle
- Triangle
- Triple top
- All
- #AAPL
- #AMZN
- #Bitcoin
- #EBAY
- #FB
- #GOOG
- #INTC
- #KO
- #MA
- #MCD
- #MSFT
- #NTDOY
- #PEP
- #TSLA
- #TWTR
- AUDCAD
- AUDCHF
- AUDJPY
- AUDUSD
- EURCAD
- EURCHF
- EURGBP
- EURJPY
- EURNZD
- EURRUB
- EURUSD
- GBPAUD
- GBPCHF
- GBPJPY
- GBPUSD
- GOLD
- NZDCAD
- NZDCHF
- NZDJPY
- NZDUSD
- SILVER
- USDCAD
- USDCHF
- USDJPY
- USDRUB
- All
- M5
- M15
- M30
- H1
- D1
- All
- Buy
- Sale
- All
- 1
- 2
- 3
- 4
- 5

El patrón gráfico Banderín alcista se ha formado en el instrumento GBPAUD M5. Este tipo de patrón entra en la categoría de patrones de continuación. En este caso
Los marcos de tiempo M5 y M15 pueden tener más puntos de entrada falsos.
Open chart in a new window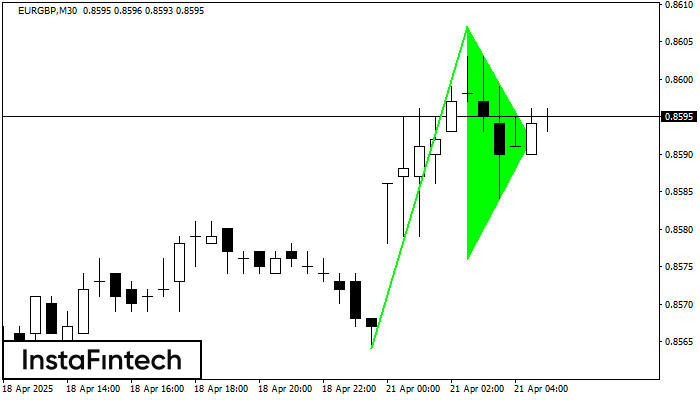
El patrón gráfico Banderín alcista se ha formado en el instrumento EURGBP M30. Este tipo de patrón entra en la categoría de patrones de continuación. En este caso
Open chart in a new window
El patrón Bandera bajista ha sido formado en el gráfico AUDJPY M15 que señala que la tendencia bajista continuará. Si el precio rompe por debajo del mínimo a 90.01, entonces
Los marcos de tiempo M5 y M15 pueden tener más puntos de entrada falsos.
Open chart in a new window


