

signal strength 2 of 5
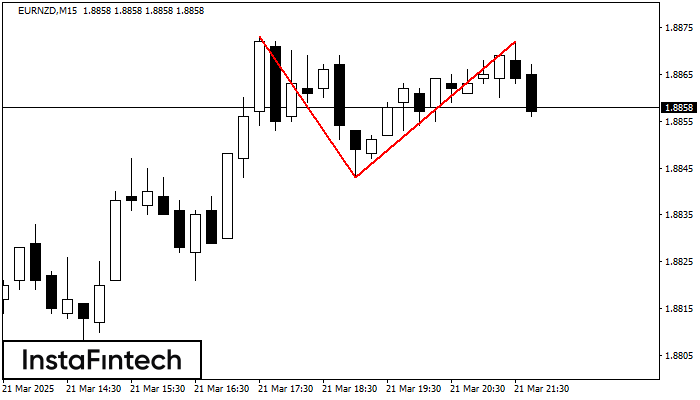
The Double Top reversal pattern has been formed on EURNZD M15. Characteristics: the upper boundary 1.8873; the lower boundary 1.8843; the width of the pattern is 29 points. Sell trades are better to be opened below the lower boundary 1.8843 with a possible movements towards the 1.8821 level.
The M5 and M15 time frames may have more false entry points.
- All
- Double Top
- Flag
- Head and Shoulders
- Pennant
- Rectangle
- Triangle
- Triple top
- All
- #AAPL
- #AMZN
- #Bitcoin
- #EBAY
- #FB
- #GOOG
- #INTC
- #KO
- #MA
- #MCD
- #MSFT
- #NTDOY
- #PEP
- #TSLA
- #TWTR
- AUDCAD
- AUDCHF
- AUDJPY
- AUDUSD
- EURCAD
- EURCHF
- EURGBP
- EURJPY
- EURNZD
- EURRUB
- EURUSD
- GBPAUD
- GBPCHF
- GBPJPY
- GBPUSD
- GOLD
- NZDCAD
- NZDCHF
- NZDJPY
- NZDUSD
- SILVER
- USDCAD
- USDCHF
- USDJPY
- USDRUB
- All
- M5
- M15
- M30
- H1
- D1
- All
- Buy
- Sale
- All
- 1
- 2
- 3
- 4
- 5
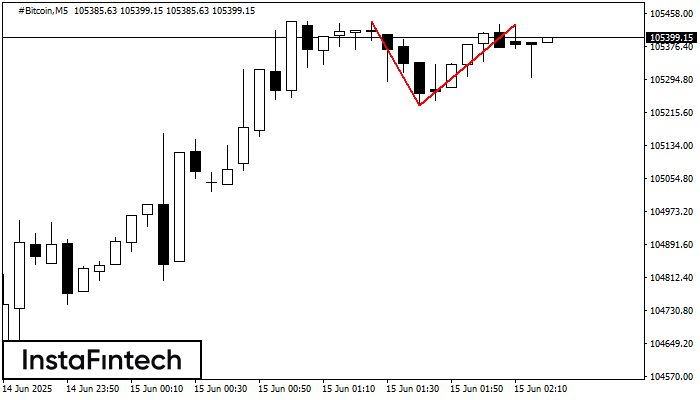
На торговом графике #Bitcoin M5 сформировалась разворотная фигура «Двойная вершина». Характеристика: Верхняя граница 105430.30; Нижняя граница 105231.35; Ширина фигуры 19895 пунктов. Сигнал: Пробой нижней границы 105231.35 приведет к дальнейшему нисходящему
Таймфреймы М5 и М15 могут иметь больше ложных точек входа.
Открыть график инструмента в новом окне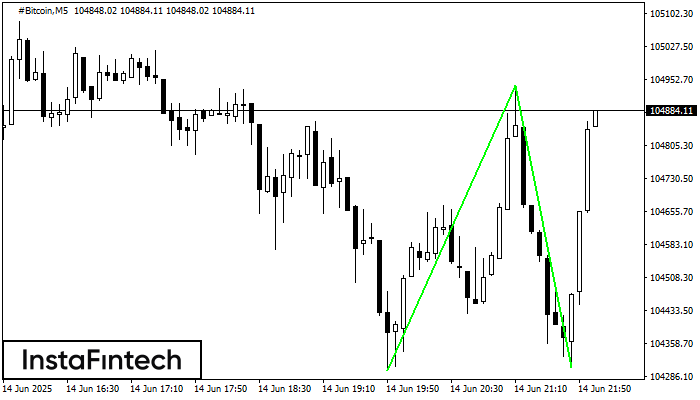
Сформирована фигура «Двойное дно» на графике #Bitcoin M5. Характеристика: Уровень поддержки 104299.16; Уровень сопротивления 104939.96; Ширина фигуры 64080 пунктов. В случае пробоя уровня сопротивления можно будет прогнозировать изменение тенденции
Таймфреймы М5 и М15 могут иметь больше ложных точек входа.
Открыть график инструмента в новом окне
Сформирована фигура «Двойное дно» на графике #Bitcoin M15. Характеристика: Уровень поддержки 104607.76; Уровень сопротивления 106173.71; Ширина фигуры 156595 пунктов. В случае пробоя уровня сопротивления можно будет прогнозировать изменение тенденции
Таймфреймы М5 и М15 могут иметь больше ложных точек входа.
Открыть график инструмента в новом окне


