

signal strength 1 of 5
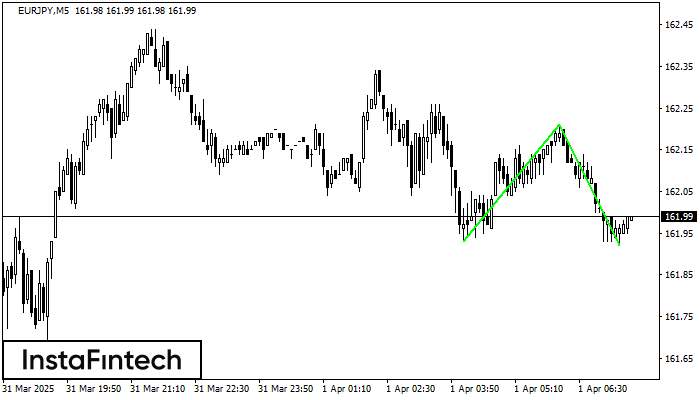
The Double Bottom pattern has been formed on EURJPY M5. Characteristics: the support level 161.93; the resistance level 162.21; the width of the pattern 28 points. If the resistance level is broken, a change in the trend can be predicted with the first target point lying at the distance of 29 points.
The M5 and M15 time frames may have more false entry points.
- All
- Double Top
- Flag
- Head and Shoulders
- Pennant
- Rectangle
- Triangle
- Triple top
- All
- #AAPL
- #AMZN
- #Bitcoin
- #EBAY
- #FB
- #GOOG
- #INTC
- #KO
- #MA
- #MCD
- #MSFT
- #NTDOY
- #PEP
- #TSLA
- #TWTR
- AUDCAD
- AUDCHF
- AUDJPY
- AUDUSD
- EURCAD
- EURCHF
- EURGBP
- EURJPY
- EURNZD
- EURRUB
- EURUSD
- GBPAUD
- GBPCHF
- GBPJPY
- GBPUSD
- GOLD
- NZDCAD
- NZDCHF
- NZDJPY
- NZDUSD
- SILVER
- USDCAD
- USDCHF
- USDJPY
- USDRUB
- All
- M5
- M15
- M30
- H1
- D1
- All
- Buy
- Sale
- All
- 1
- 2
- 3
- 4
- 5
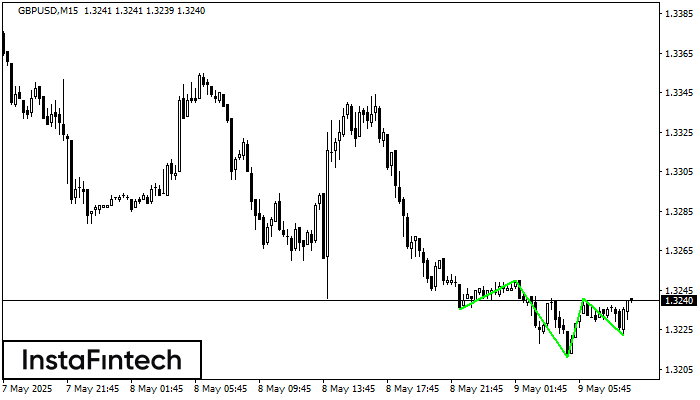
According to the chart of M15, GBPUSD produced the pattern termed the Inverse Head and Shoulder. The Head is fixed at 1.3211 while the median line of the Neck
The M5 and M15 time frames may have more false entry points.
Open chart in a new window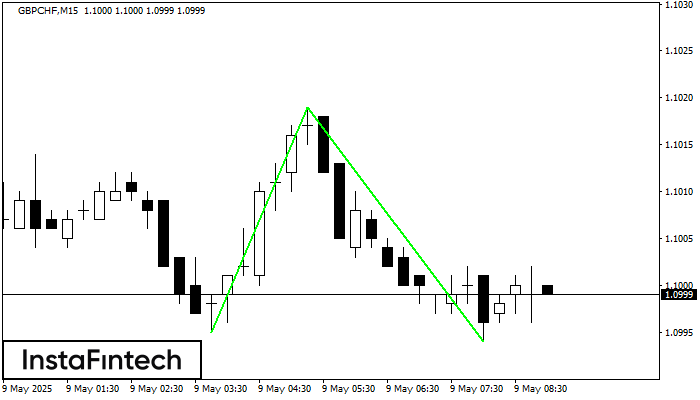
The Double Bottom pattern has been formed on GBPCHF M15; the upper boundary is 1.1019; the lower boundary is 1.0994. The width of the pattern is 24 points. In case
The M5 and M15 time frames may have more false entry points.
Open chart in a new window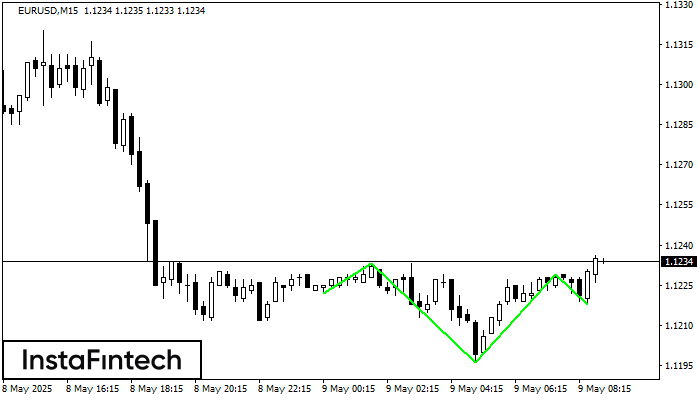
According to M15, EURUSD is shaping the technical pattern – the Inverse Head and Shoulder. In case the Neckline 1.1233/1.1229 is broken out, the instrument is likely to move toward
The M5 and M15 time frames may have more false entry points.
Open chart in a new window


