


signal strength 1 of 5
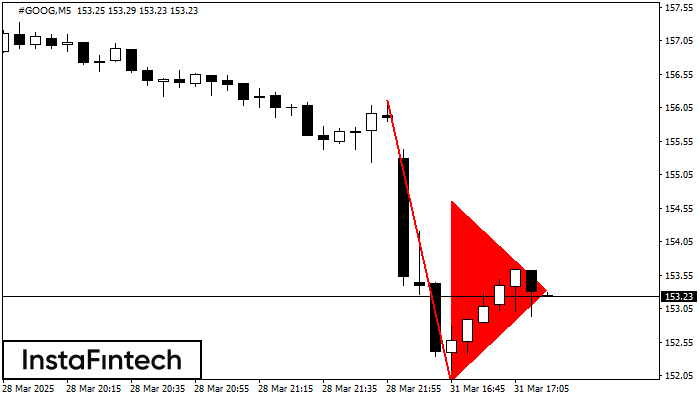
The Bearish pennant pattern has formed on the #GOOG M5 chart. The pattern signals continuation of the downtrend in case the pennant’s low of 151.97 is broken through. Recommendations: Place the sell stop pending order 10 pips below the pattern’s low. Place the take profit order at the projection distance of the flagpole height.
The M5 and M15 time frames may have more false entry points.
See Also
- All
- Double Top
- Flag
- Head and Shoulders
- Pennant
- Rectangle
- Triangle
- Triple top
- All
- #AAPL
- #AMZN
- #Bitcoin
- #EBAY
- #FB
- #GOOG
- #INTC
- #KO
- #MA
- #MCD
- #MSFT
- #NTDOY
- #PEP
- #TSLA
- #TWTR
- AUDCAD
- AUDCHF
- AUDJPY
- AUDUSD
- EURCAD
- EURCHF
- EURGBP
- EURJPY
- EURNZD
- EURRUB
- EURUSD
- GBPAUD
- GBPCHF
- GBPJPY
- GBPUSD
- GOLD
- NZDCAD
- NZDCHF
- NZDJPY
- NZDUSD
- SILVER
- USDCAD
- USDCHF
- USDJPY
- USDRUB
- All
- M5
- M15
- M30
- H1
- D1
- All
- Buy
- Sale
- All
- 1
- 2
- 3
- 4
- 5
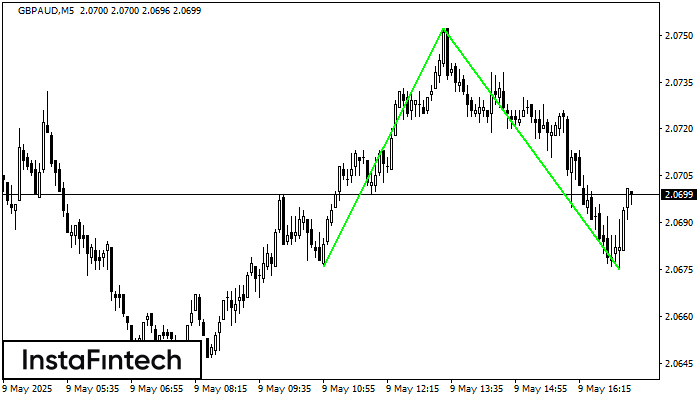
The Double Bottom pattern has been formed on GBPAUD M5. Characteristics: the support level 2.0676; the resistance level 2.0752; the width of the pattern 76 points. If the resistance level
The M5 and M15 time frames may have more false entry points.
Open chart in a new window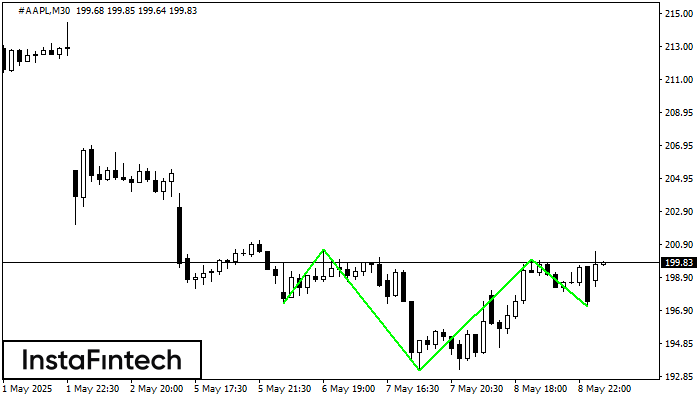
According to M30, #AAPL is shaping the technical pattern – the Inverse Head and Shoulder. In case the Neckline 200.60/200.00 is broken out, the instrument is likely to move toward
Open chart in a new window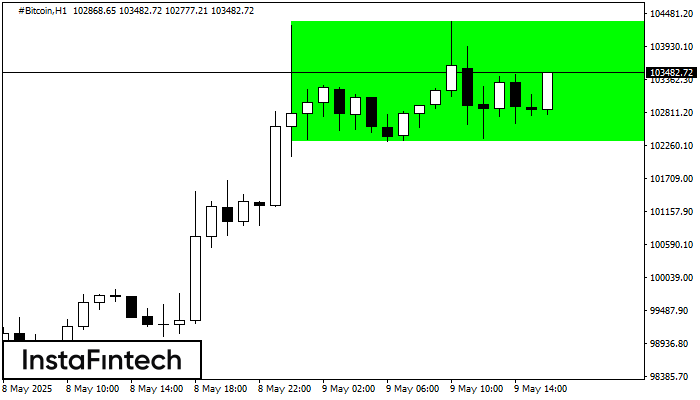
According to the chart of H1, #Bitcoin formed the Bullish Rectangle which is a pattern of a trend continuation. The pattern is contained within the following borders: the lower border
Open chart in a new window


