


signal strength 1 of 5
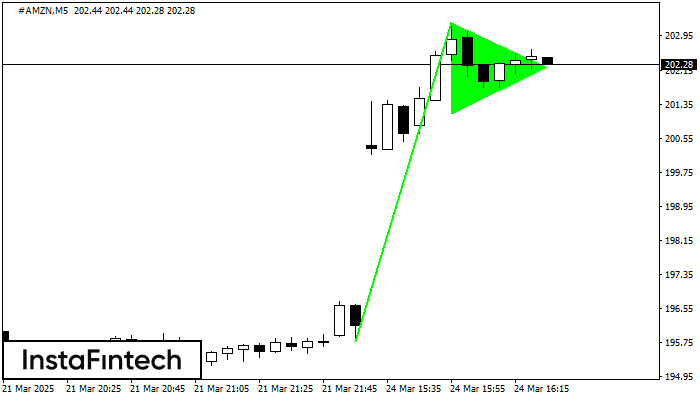
The Bullish pennant graphic pattern has formed on the #AMZN M5 instrument. This pattern type falls under the category of continuation patterns. In this case, if the quote can breaks out high, is expected to continue the upward trend to level 203.41.
The M5 and M15 time frames may have more false entry points.
- All
- Double Top
- Flag
- Head and Shoulders
- Pennant
- Rectangle
- Triangle
- Triple top
- All
- #AAPL
- #AMZN
- #Bitcoin
- #EBAY
- #FB
- #GOOG
- #INTC
- #KO
- #MA
- #MCD
- #MSFT
- #NTDOY
- #PEP
- #TSLA
- #TWTR
- AUDCAD
- AUDCHF
- AUDJPY
- AUDUSD
- EURCAD
- EURCHF
- EURGBP
- EURJPY
- EURNZD
- EURRUB
- EURUSD
- GBPAUD
- GBPCHF
- GBPJPY
- GBPUSD
- GOLD
- NZDCAD
- NZDCHF
- NZDJPY
- NZDUSD
- SILVER
- USDCAD
- USDCHF
- USDJPY
- USDRUB
- All
- M5
- M15
- M30
- H1
- D1
- All
- Buy
- Sale
- All
- 1
- 2
- 3
- 4
- 5
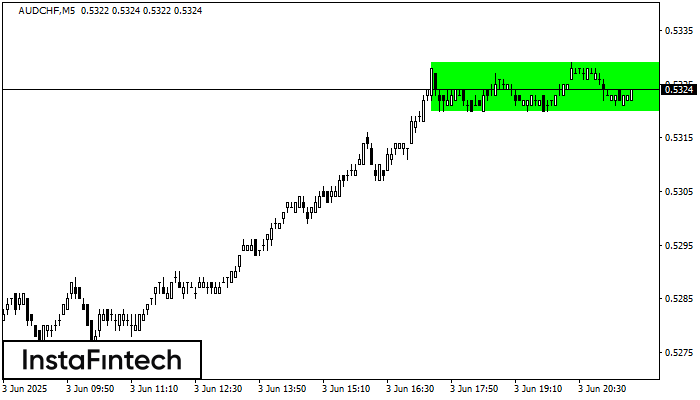
According to the chart of M5, AUDCHF formed the Bullish Rectangle. This type of a pattern indicates a trend continuation. It consists of two levels: resistance 0.5329 and support 0.5320
The M5 and M15 time frames may have more false entry points.
Open chart in a new window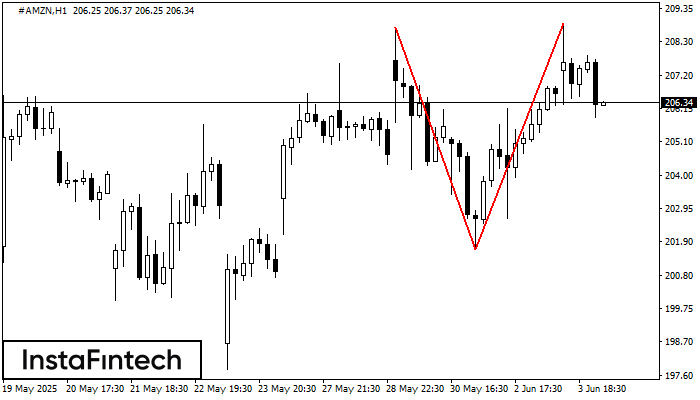
On the chart of #AMZN H1 the Double Top reversal pattern has been formed. Characteristics: the upper boundary 208.87; the lower boundary 201.64; the width of the pattern 723 points
Open chart in a new window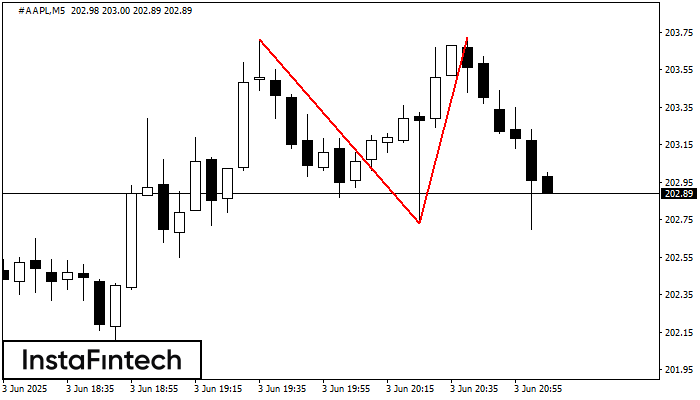
The Double Top pattern has been formed on #AAPL M5. It signals that the trend has been changed from upwards to downwards. Probably, if the base of the pattern 202.73
The M5 and M15 time frames may have more false entry points.
Open chart in a new window


