


signal strength 1 of 5

The EURJPY M5 formed the Head and Shoulders pattern with the following features: The Head’s top is at 162.14, the Neckline and the upward angle are at 161.98/161.96. The formation of this pattern can bring about changes in the current trend from bullish to bearish. In case the pattern triggers the expected changes, the price of EURJPY will go towards 161.81.
The M5 and M15 time frames may have more false entry points.
See Also
- All
- Double Top
- Flag
- Head and Shoulders
- Pennant
- Rectangle
- Triangle
- Triple top
- All
- #AAPL
- #AMZN
- #Bitcoin
- #EBAY
- #FB
- #GOOG
- #INTC
- #KO
- #MA
- #MCD
- #MSFT
- #NTDOY
- #PEP
- #TSLA
- #TWTR
- AUDCAD
- AUDCHF
- AUDJPY
- AUDUSD
- EURCAD
- EURCHF
- EURGBP
- EURJPY
- EURNZD
- EURRUB
- EURUSD
- GBPAUD
- GBPCHF
- GBPJPY
- GBPUSD
- GOLD
- NZDCAD
- NZDCHF
- NZDJPY
- NZDUSD
- SILVER
- USDCAD
- USDCHF
- USDJPY
- USDRUB
- All
- M5
- M15
- M30
- H1
- D1
- All
- Buy
- Sale
- All
- 1
- 2
- 3
- 4
- 5
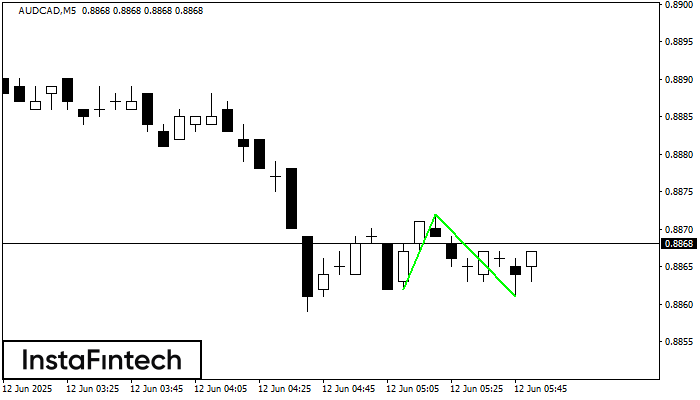
The Double Bottom pattern has been formed on AUDCAD M5. Characteristics: the support level 0.8862; the resistance level 0.8872; the width of the pattern 10 points. If the resistance level
The M5 and M15 time frames may have more false entry points.
Open chart in a new window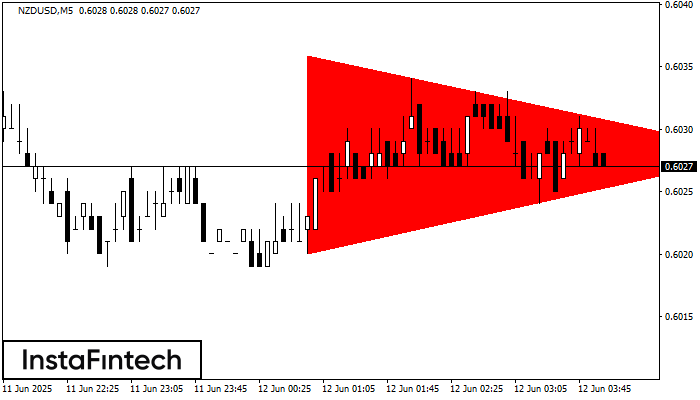
According to the chart of M5, NZDUSD formed the Bearish Symmetrical Triangle pattern. This pattern signals a further downward trend in case the lower border 0.6020 is breached. Here
The M5 and M15 time frames may have more false entry points.
Open chart in a new window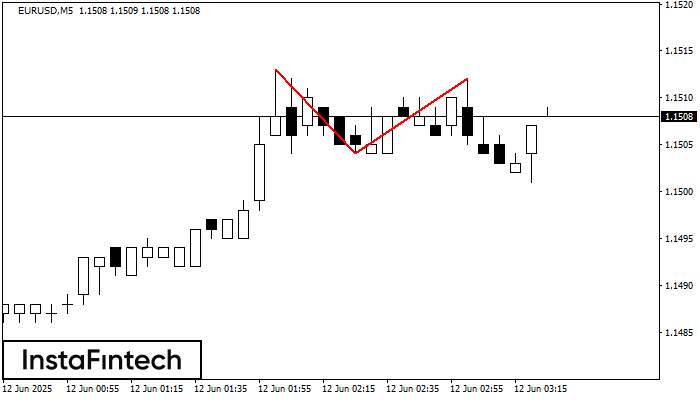
On the chart of EURUSD M5 the Double Top reversal pattern has been formed. Characteristics: the upper boundary 1.1512; the lower boundary 1.1504; the width of the pattern 8 points
The M5 and M15 time frames may have more false entry points.
Open chart in a new window


