

signal strength 1 of 5
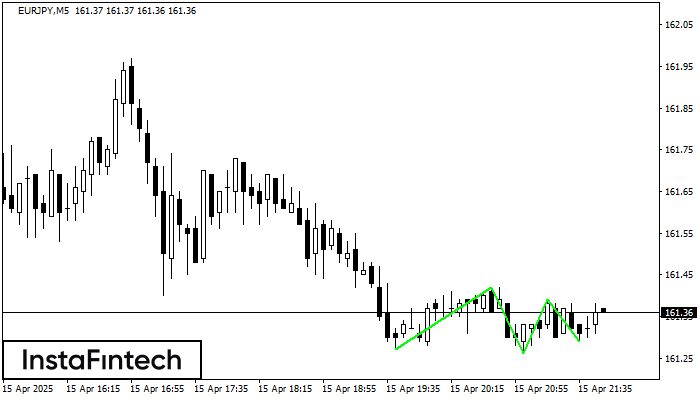
The Triple Bottom pattern has been formed on EURJPY M5. It has the following characteristics: resistance level 161.42/161.39; support level 161.27/161.29; the width is 15 points. In the event of a breakdown of the resistance level of 161.42, the price is likely to continue an upward movement at least to 161.41.
The M5 and M15 time frames may have more false entry points.
See Also
- All
- Double Top
- Flag
- Head and Shoulders
- Pennant
- Rectangle
- Triangle
- Triple top
- All
- #AAPL
- #AMZN
- #Bitcoin
- #EBAY
- #FB
- #GOOG
- #INTC
- #KO
- #MA
- #MCD
- #MSFT
- #NTDOY
- #PEP
- #TSLA
- #TWTR
- AUDCAD
- AUDCHF
- AUDJPY
- AUDUSD
- EURCAD
- EURCHF
- EURGBP
- EURJPY
- EURNZD
- EURRUB
- EURUSD
- GBPAUD
- GBPCHF
- GBPJPY
- GBPUSD
- GOLD
- NZDCAD
- NZDCHF
- NZDJPY
- NZDUSD
- SILVER
- USDCAD
- USDCHF
- USDJPY
- USDRUB
- All
- M5
- M15
- M30
- H1
- D1
- All
- Buy
- Sale
- All
- 1
- 2
- 3
- 4
- 5
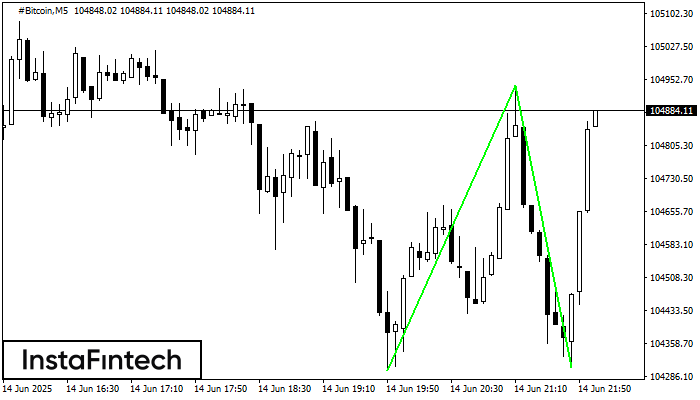
The Double Bottom pattern has been formed on #Bitcoin M5. Characteristics: the support level 104299.16; the resistance level 104939.96; the width of the pattern 64080 points. If the resistance level
The M5 and M15 time frames may have more false entry points.
Открыть график инструмента в новом окне
The Double Bottom pattern has been formed on #Bitcoin M15. Characteristics: the support level 104607.76; the resistance level 106173.71; the width of the pattern 156595 points. If the resistance level
The M5 and M15 time frames may have more false entry points.
Открыть график инструмента в новом окне
The Triple Bottom pattern has formed on the chart of AUDCHF M5. Features of the pattern: The lower line of the pattern has coordinates 0.5269 with the upper limit 0.5269/0.5268
The M5 and M15 time frames may have more false entry points.
Открыть график инструмента в новом окне


