


signal strength 1 of 5
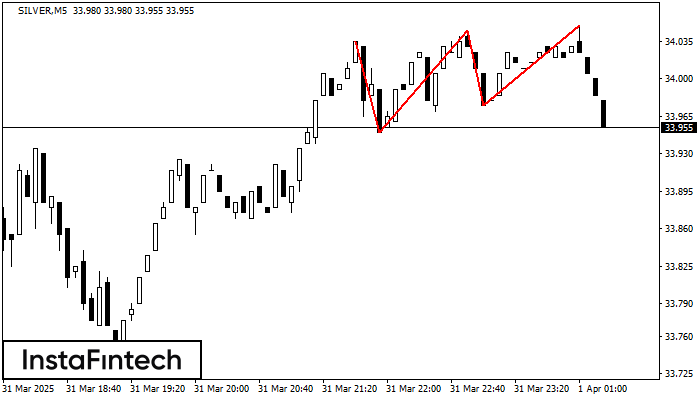
On the chart of the SILVER M5 trading instrument, the Triple Top pattern that signals a trend change has formed. It is possible that after formation of the third peak, the price will try to break through the resistance level 33.95, where we advise to open a trading position for sale. Take profit is the projection of the pattern’s width, which is 85 points.
The M5 and M15 time frames may have more false entry points.
See Also
- All
- Double Top
- Flag
- Head and Shoulders
- Pennant
- Rectangle
- Triangle
- Triple top
- All
- #AAPL
- #AMZN
- #Bitcoin
- #EBAY
- #FB
- #GOOG
- #INTC
- #KO
- #MA
- #MCD
- #MSFT
- #NTDOY
- #PEP
- #TSLA
- #TWTR
- AUDCAD
- AUDCHF
- AUDJPY
- AUDUSD
- EURCAD
- EURCHF
- EURGBP
- EURJPY
- EURNZD
- EURRUB
- EURUSD
- GBPAUD
- GBPCHF
- GBPJPY
- GBPUSD
- GOLD
- NZDCAD
- NZDCHF
- NZDJPY
- NZDUSD
- SILVER
- USDCAD
- USDCHF
- USDJPY
- USDRUB
- All
- M5
- M15
- M30
- H1
- D1
- All
- Buy
- Sale
- All
- 1
- 2
- 3
- 4
- 5
was formed on 13.06 at 22:45:28 (UTC+0)
signal strength 1 of 5

รูปแบบ รูปแบบกราฟจุดสามยอดขาลง (Triple Bottom) ได้สร้างขึ้นมาในชาร์ตของ AUDCHF M5 ลักษณะของกราฟรูปแบบนี้: เส้นด้านล่างของกราฟรูปแบบนี้มีพิกัดอยู่ที่ 0.5269 พร้อมกับลิมิตด้านบน 0.5269/0.5268,ระยะของความกว้างคือ 9 จุด การก่อตัวของกราฟรูปแบบ
ขอบเตระยะเวลาใน M5 และ M15 อาจจะมีตำแหน่งการเข้าใช้งานที่ผิดพลาดมากยิ่งขึ้น
Open chart in a new windowwas formed on 13.06 at 22:20:49 (UTC+0)
signal strength 1 of 5

อ้างอิงจากชาร์ตของ M5, GBPAUD ที่ได้สร้างรูปแบบ รูปแบบสามเหลี่ยมสมมาตรขาขึ้น (Bullish Symmetrical Triangle) ออกมา ซึ่งแสดงให้เห็นว่า แนวโน้มยังคงเดินหน้าต่อไป คำอธิบาย ขอบเขตด้านบนของรูปแบบนี้สัมผัสพิกัด 2.0911/2.0896 แม้ว่าขอบเขตด้านล่างก้าวผ่าน
ขอบเตระยะเวลาใน M5 และ M15 อาจจะมีตำแหน่งการเข้าใช้งานที่ผิดพลาดมากยิ่งขึ้น
Open chart in a new windowwas formed on 13.06 at 21:35:35 (UTC+0)
signal strength 1 of 5

อ้างอิงจากชาร์ตของ M5, #TSLA ที่ได้สร้างรูปแบบ รูปแบบสามเหลี่ยมสมมาตรขาลง (Bearish Symmetrical Triangle) ออกมา สำหรับคำแนะนำการซื้อขาย คือ การเคลื่อนตัวทะลุผ่านขอบเขตในด้านล่าง 313.81 อาจจะช่วยสนับสนุนต่อแนวโน้มขาลงอย่างต่อเนื่อง
ขอบเตระยะเวลาใน M5 และ M15 อาจจะมีตำแหน่งการเข้าใช้งานที่ผิดพลาดมากยิ่งขึ้น
Open chart in a new window


