empty
26.03.2025 06:24 PM
GBP/USD: Trading Plan for the U.S. Session on March 26th (Review of the Morning Trades)

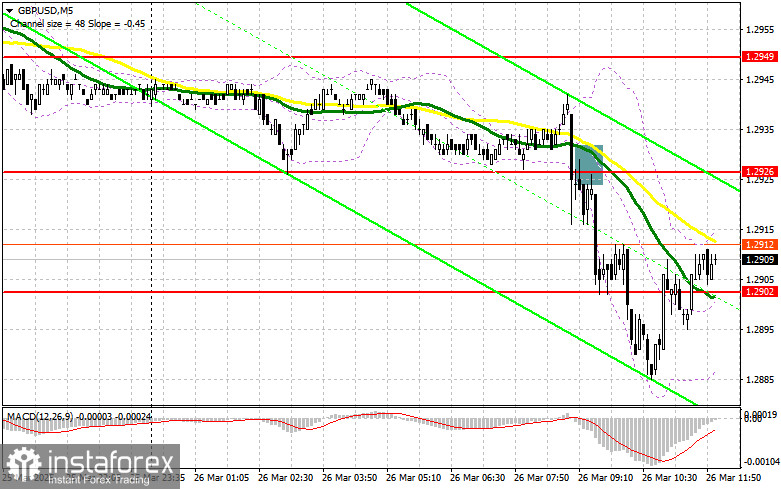
In my morning forecast, I highlighted the 1.2926 level and planned to make trading decisions based on it. Let's look at the 5-minute chart and analyze what happened. The breakout and retest of 1.2946 provided an entry point for selling the pound, which—together with news of declining U.S. inflation—triggered a large sell-off in the pair. The technical outlook for the second half of the day has been revised.

This image is no longer relevant

To open long positions on GBP/USD:

The U.K. recorded a slowdown in inflation, which triggered a sharp drop in the pound. Statistical reports indicated a weakening in consumer price growth, fueling speculation about potential monetary easing from the Bank of England. Against this backdrop, traders rushed to sell the pound, causing the pair to plunge.

In the second half of the day, we expect U.S. data on Durable Goods Orders and speeches by FOMC members Neel Kashkari and Alberto Musalem. If market reaction to the data and remarks is bearish, only a false breakout at the 1.2886 level will provide a good entry point for long positions with a target of recovering to resistance at 1.2916. A breakout and retest of this range from above will offer another entry signal for long positions, with the prospect of reaching 1.2941. The ultimate target will be the area of 1.2964, where I plan to take profit.

If GBP/USD declines and buyers show no activity at 1.2886 in the second half of the day, pressure on the pound may return, trapping the pair within a sideways channel. In that case, a false breakout at 1.2861 will be a suitable condition for initiating long positions. I also plan to buy GBP/USD on a rebound from the 1.2835 support level for a 30–35 point intraday correction.

To open short positions on GBP/USD:

The pound collapsed after the data release, and now bears need to defend the nearest resistance at 1.2916 to sustain the downtrend. If the reaction to reports is bullish, only a false breakout at 1.2916 will offer an entry point for selling, targeting new support at 1.2886, which formed during the first half of the day. A breakout and retest of this range from below will trigger stop-losses and open the path toward 1.2861, marking a significant correction. The final target will be the 1.2835 area, where I plan to take profit. Testing this level could stall the bullish recovery.

If demand for the pound returns in the second half of the day and bears fail to assert themselves at 1.2916, it's better to delay selling until a test of the 1.2941 resistance level. This level lies just below the moving averages, which currently favor sellers. I will only open short positions there after a failed breakout. If there is no downward movement at that level either, I will look for a short-term rebound entry at 1.2964, targeting a 30–35 point intraday pullback.

This image is no longer relevant

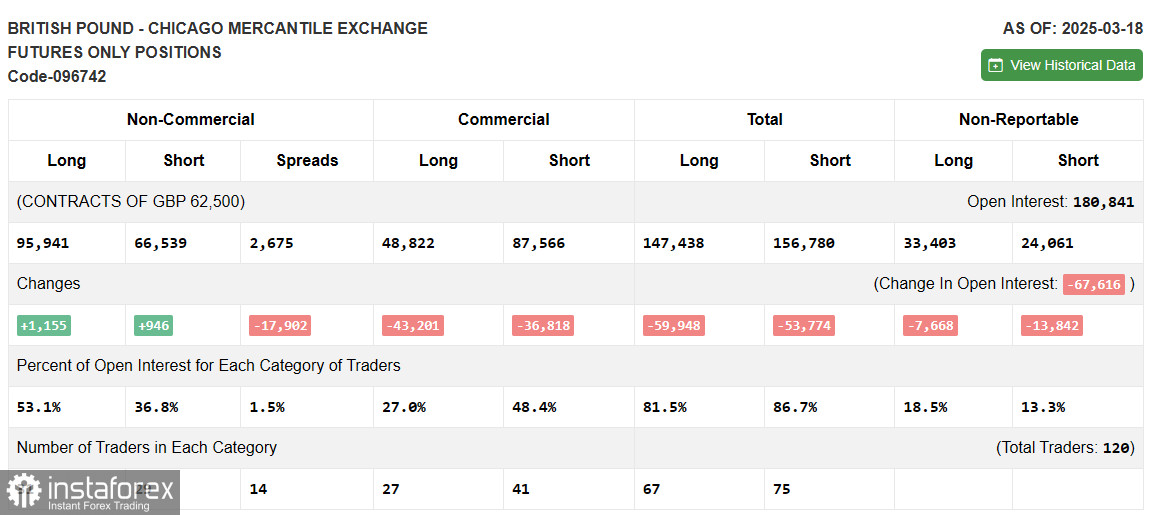
COT Report (Commitment of Traders) – March 18:

The report showed an increase in both long and short positions, but the growth in long positions was significantly larger, giving buyers a notable advantage. This is confirmed by the GBP/USD chart. Following the Bank of England's meeting, it became clear that the regulator is taking a more gradual approach to rate cuts—and may even adopt a more hawkish stance going forward. Many are concerned about Trump's tariff policies, which could spark an inflation spike that the U.K. is already struggling to control. The current stance of the Bank of England supports pound buyers and will likely continue to do so.

The latest COT report indicated that long non-commercial positions increased by 1,155 to 95,941, while short non-commercial positions grew by only 946 to 66,539. As a result, the gap between long and short positions narrowed by 17,902.

This image is no longer relevant

Indicator Signals:

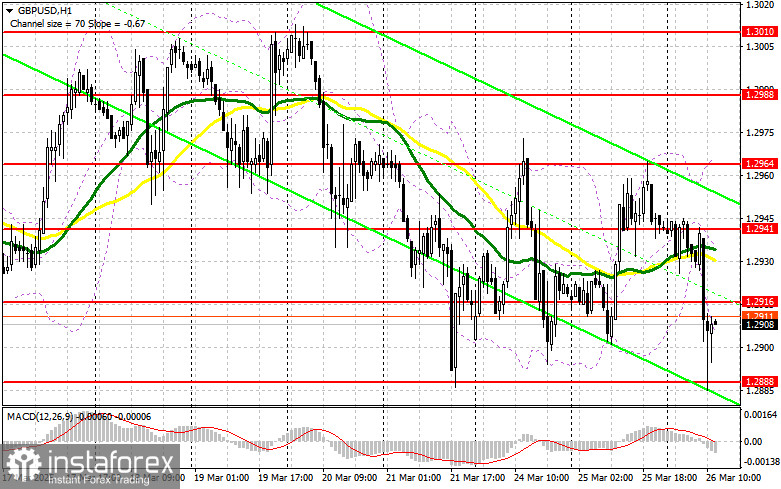
Moving Averages Trading is occurring below the 30- and 50-day moving averages, indicating further downside potential for the pair.

Note: The author uses the H1 (hourly) chart for moving average periods and prices, which may differ from the standard D1 (daily) chart settings.

Bollinger Bands In case of a decline, the lower boundary of the indicator around 1.2906 will serve as support.

Indicator Descriptions:

  • Moving average (MA): Smooths out volatility and noise to identify the current trend.
    • Period 50 – marked in yellow
    • Period 30 – marked in green
  • MACD (Moving Average Convergence/Divergence):
    • Fast EMA: 12
    • Slow EMA: 26
    • Signal Line SMA: 9
  • Bollinger Bands: Period – 20
  • Non-commercial traders: Speculators such as retail traders, hedge funds, and large institutions using the futures market for speculative purposes.
  • Long non-commercial positions: Total long open interest held by non-commercial traders.
  • Short non-commercial positions: Total short open interest held by non-commercial traders.
  • Net non-commercial position: The difference between short and long positions held by non-commercial traders.
Miroslaw Bawulski,
Analytical expert of InstaForex
© 2007-2025
Summary
Urgency
Analytic
Maxim Magdalinin
Start trade
Earn on cryptocurrency rate changes with InstaForex
Download MetaTrader 4 and open your first trade
  • Grand Choice
    Contest by
    InstaForex
    InstaForex always strives to help you
    fulfill your biggest dreams.
    JOIN CONTEST

Recommended Stories

How to Trade the GBP/USD Pair on August 15? Simple Tips and Trade Analysis for Beginners

Analysis of Thursday's Trades 1H Chart of GBP/USD The GBP/USD pair also corrected slightly lower on Thursday amid the high PPI reading. As we have already mentioned, even such

Paolo Greco 06:13 2025-08-15 UTC+2

How to Trade the EUR/USD Pair on August 15? Simple Tips and Trade Analysis for Beginners

Analysis of Thursday's Trades 1H Chart of EUR/USD On Thursday, the EUR/USD currency pair traded lower. Four macroeconomic reports were published during the day, three of which had no impact

Paolo Greco 06:13 2025-08-15 UTC+2

Trading Recommendations and Trade Breakdown for GBP/USD on August 15: The Pound Pulled Back Slightly

On Thursday, the GBP/USD currency pair also traded lower, with the U.S. Producer Price Index being the main driver. Initially, we assumed that this indicator was unlikely to provoke

Paolo Greco 03:50 2025-08-15 UTC+2

Trading Recommendations and Trade Breakdown for EUR/USD on August 15: Inflation Sank the Dollar, Inflation Also Lent a Hand

On Thursday, the EUR/USD currency pair showed a decent decline, which fully aligns with the current technical picture. It should be noted that an uptrend does not mean the price

Paolo Greco 03:50 2025-08-15 UTC+2

How to Trade the GBP/USD Pair on August 14? Simple Tips and Trade Analysis for Beginners

Analysis of Wednesday's Trades 1H Chart of GBP/USD The GBP/USD pair also continued moving north on Wednesday, although there were no local reasons for this. Nevertheless, the British pound keeps

Paolo Greco 06:49 2025-08-14 UTC+2

How to Trade the EUR/USD Pair on August 14? Simple Tips and Trade Analysis for Beginners

Analysis of Wednesday's Trades 1H Chart of EUR/USD On Wednesday, the EUR/USD currency pair continued its upward movement. It was not a strong rise, but it was upward, in line

Paolo Greco 06:49 2025-08-14 UTC+2

Trading Recommendations and Trade Breakdown for GBP/USD on August 14: The Pound Surprises for the Second Day

On Wednesday, the GBP/USD currency pair continued its upward movement, despite the absence of significant reports, news from Donald Trump, and fundamental events during the day. Once again, we draw

Paolo Greco 03:52 2025-08-14 UTC+2

Trading Recommendations and Trade Breakdown for EUR/USD on August 14: Inflation Continues to Pressure the Dollar

On Wednesday, the EUR/USD currency pair continued its upward movement, despite the absence of any important events or reports during the day. However, the broader fundamental backdrop — driven

Paolo Greco 03:52 2025-08-14 UTC+2

How to Trade the GBP/USD Pair on August 13? Simple Tips and Trade Analysis for Beginners

Analysis of Tuesday's Trades 1H Chart of GBP/USD The GBP/USD pair also showed a relatively strong upward move, but unlike EUR/USD, it began rising from early morning. Data from

Paolo Greco 06:44 2025-08-13 UTC+2

How to Trade the EUR/USD Pair on August 13? Simple Tips and Trade Analysis for Beginners

Analysis of Tuesday's Trades 1H Chart of EUR/USD On Tuesday, the EUR/USD currency pair traded higher for a completely logical reason. The US Consumer Price Index showed a very unexpected

Paolo Greco 06:44 2025-08-13 UTC+2
Can't speak right now?
Ask your question in the chat.
Widget callback
 

Dear visitor,

Your IP address shows that you are currently located in the USA. If you are a resident of the United States, you are prohibited from using the services of InstaFintech Group including online trading, online transfers, deposit/withdrawal of funds, etc.

If you think you are seeing this message by mistake and your location is not the US, kindly proceed to the website. Otherwise, you must leave the website in order to comply with government restrictions.

Why does your IP address show your location as the USA?

  • - you are using a VPN provided by a hosting company based in the United States;
  • - your IP does not have proper WHOIS records;
  • - an error occurred in the WHOIS geolocation database.

Please confirm whether you are a US resident or not by clicking the relevant button below. If you choose the wrong option, being a US resident, you will not be able to open an account with InstaForex anyway.

We are sorry for any inconvenience caused by this message.