empty
26.02.2025 01:47 PM
Wave analysis of BTC/USD on February 26. Bitcoin falls asleep at $96,000 and wakes up at $88,000

This image is no longer relevant

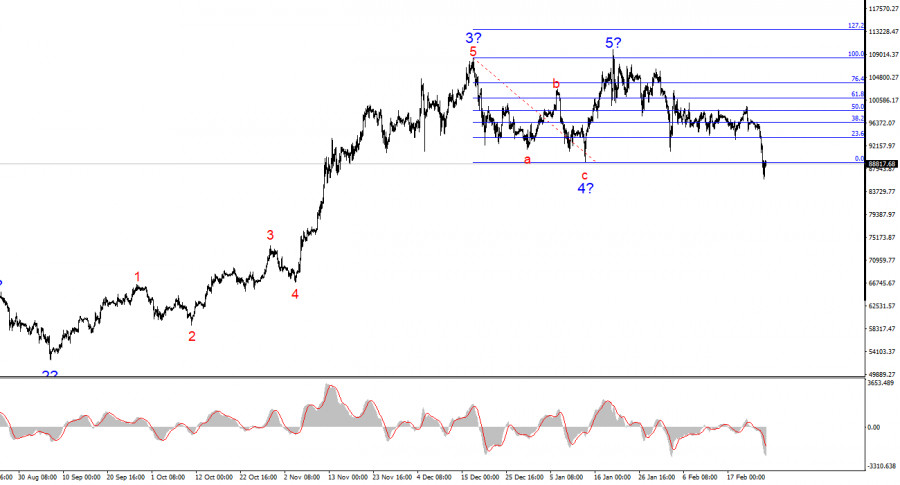
The wave analysis of the 4-hour BTC/USD chart is quite clear. After a long and complex a-b-c-d-e correction, which unfolded between March 14 and August 5, a new impulse wave began to form, developing into a five-wave structure.

Judging by the size of the first wave, the fifth wave appears to be shortened. Based on this, I did not expect—and still do not expect—Bitcoin to rise above $110,000–$115,000 in the coming months.

Besides, wave 4 consists of three elements, which confirms the accuracy of the current wave count. The news background has been supporting Bitcoin's growth due to a steady influx of institutional investments, including from government entities and pension funds.

However, Trump's policies could drive investors away from the crypto market. So, the flagship crypto may trade without a clear-cut trend indefinitely. The wave that began on January 20 does not resemble a true impulse wave, indicating that we are dealing with a complex corrective structure that could persist for months.

The crash has happened. Will it continue?

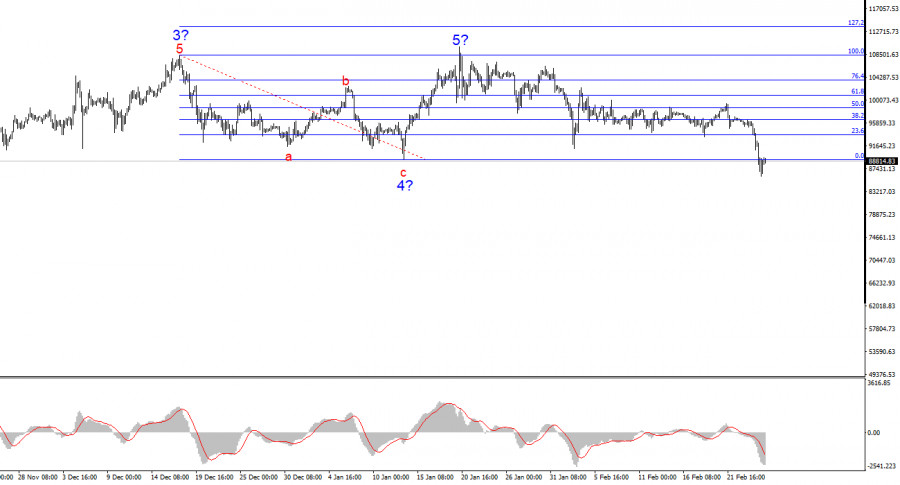
Over the past two days, BTC/USD has dropped by $6,500. However, this decline is not as severe as it might seem. Even after the sell-off on Monday and Tuesday, it is too early to confirm the start of a new bearish trend.

At this point, the price has only briefly broken below Wave 4's low. The internal structure of the wave that began on January 20 does not resemble a true impulse wave.

Thus, I lean toward the view that Bitcoin has entered a corrective phase, which could last for an extended period.

It's also important to note that a $20,000 drop from the last peak cannot be classified as a crash or a major correction. Yes, Bitcoin has fallen by $20,000, but before that, it had surged by nearly $100,000. Sharp price swings are an intrinsic feature of Bitcoin, so a $20,000 decline is merely one corrective wave.

Recently, the news backdrop has been relatively weak and was not the driving force behind the latest market downturn. Moreover, the decline was not sudden or drastic.

While I believe the downtrend could extend in the coming days, a full-scale collapse seems unlikely. The internal structure of the first wave in this new trend segment appears complex and unclear, so I am not identifying subwaves within it.

This image is no longer relevant

Key takeaways

Based on my wave analysis of BTC/USD, I conclude that Bitcoin's bullish phase has ended. All signs indicate that a complex correction is underway.

That's why I have previously advised against buying Bitcoin, and now I strongly discourage it.

A drop below the low of wave 4 will confirm that BTC has entered a corrective downtrend. Given this, the best strategy is to look for short-selling opportunities on lower timeframes.

Bitcoin could drop to $83,000 (127.2% Fibonacci level) in the near future. On a higher wave scale, a five-wave bullish structure is visible, suggesting that a corrective downtrend is likely to form soon.

Key principles of my analysis:

  • Wave structures should be simple and clear. Complex patterns are difficult to trade and often change.
  • If you are uncertain about the market trend, it's better to stay out.
  • There is no 100% certainty in price direction. Always use Stop Loss orders to protect your positions.
  • Wave analysis can be combined with other analytical methods and trading strategies for a more comprehensive approach.
Chin Zhao,
Analytical expert of InstaForex
© 2007-2025
Summary
Urgency
Analytic
Alexander Dneprovskiy
Start trade
Earn on cryptocurrency rate changes with InstaForex
Download MetaTrader 4 and open your first trade
  • Grand Choice
    Contest by
    InstaForex
    InstaForex always strives to help you
    fulfill your biggest dreams.
    JOIN CONTEST

Recommended Stories

Trading tips for crypto market on July 28 (North American session)

Bitcoin has once again failed in its attempt to test and consolidate above the $120,000 mark, currently dipping back below $119,000. Ethereum has also slightly retreated after attempting to break

Miroslaw Bawulski 14:04 2025-07-28 UTC+2

Bitcoin quickly regained ground

Last Friday, I noted that Bitcoin had touched the $115,000 level, and during today's Asian trading session, we already saw a test of the resistance near $119,800. This highlights

Jakub Novak 09:58 2025-07-28 UTC+2

Trading Recommendations for the Cryptocurrency Market on July 28

Bitcoin has recovered all of last week's losses and is now just one step away from the $120,000 mark. Ethereum has also seen significant growth, surpassing the $3,900 mark. There

Miroslaw Bawulski 08:29 2025-07-28 UTC+2

The Death Cross EMA condition on Solana confirms that sellers remain dominant despite the potential for temporary strength, Friday, July 25, 2025.

Solana – Friday, July 25, 2025 With the EMA in a Death Cross condition and the RSI (14) in a Neutral Bearish condition, Solana cryptocurrency indicates that sellers are still

Arief Makmur 12:03 2025-07-25 UTC+2

The appearance of divergence in the RSI on Litecoin indicates the potential for limited upside up to its pivot level on Friday, July 25, 2025.

Litecoin – Friday, July 25, 2025 The appearance of divergence between the RSI(14) indicator and Litecoin's price movement indicates the potential for limited upside. The RSI(14) remains in a neutral

Arief Makmur 12:03 2025-07-25 UTC+2

Bitcoin plunges to $115,000

Sooner or later, this had to happen. After Bitcoin had made brave attempts to break above $120,000, the price dropped to nearly $115,000. In fact, this is nothing surprising

Jakub Novak 09:41 2025-07-25 UTC+2

Tether confidently advances toward entry into the US market

Bitcoin continues to trade within the 116,500–120,000 channel, showing solid volatility. Ethereum, however, is performing significantly worse following a recent decline in spot ETF inflows. Meanwhile, yesterday Tether CEO Paolo

Jakub Novak 10:07 2025-07-24 UTC+2

Trading Recommendations for the Cryptocurrency Market on July 24

Bitcoin once again attempted to break above $119,000 but failed, retreating today toward the $117,000 level. Ethereum has dropped back below $3,600 and is currently heading toward the $3,500 area

Miroslaw Bawulski 09:20 2025-07-24 UTC+2

Ethereum enjoys buoyant demand

In recent weeks, Ethereum has demonstrated explosive growth but has still not surpassed its historical all-time high. Clearly, with new money flowing into the market, Ethereum is experiencing a demand

Jakub Novak 15:57 2025-07-23 UTC+2

Spot Ethereum keeps soaking up fresh capital

Despite Ether dipping below the $3,700 mark, net inflows into spot Ethereum ETFs reached $533.9 million yesterday, the third-largest daily inflow since their launch. According to SoSoValue, the iShares Ethereum

Jakub Novak 12:07 2025-07-23 UTC+2
Can't speak right now?
Ask your question in the chat.
Widget callback
 

Dear visitor,

Your IP address shows that you are currently located in the USA. If you are a resident of the United States, you are prohibited from using the services of InstaFintech Group including online trading, online transfers, deposit/withdrawal of funds, etc.

If you think you are seeing this message by mistake and your location is not the US, kindly proceed to the website. Otherwise, you must leave the website in order to comply with government restrictions.

Why does your IP address show your location as the USA?

  • - you are using a VPN provided by a hosting company based in the United States;
  • - your IP does not have proper WHOIS records;
  • - an error occurred in the WHOIS geolocation database.

Please confirm whether you are a US resident or not by clicking the relevant button below. If you choose the wrong option, being a US resident, you will not be able to open an account with InstaForex anyway.

We are sorry for any inconvenience caused by this message.