empty
11.11.2021 11:25 AM
Bitcoin hit its all-time high and sharply fell amid rumors of Evergrande's bankruptcy. What will happen to Bitcoin in the near future?

Last Friday, Bitcoin has updated the historical high twice but has not managed to break through the resistance at $70,800. Moreover, the cryptocurrency allowed a sharp surge in the growth of volatility following the results of yesterday. This is due to big speculative news that allowed the asset to set a new ATH and fall to a local low after a few hours. As a result, a situation was formed, in which Bitcoin's immediate plans were knocked down by a wave of impulse sales and purchases.

Due to the results of the Fed meeting, where they announced record inflation growth rates for 30 years, the price soared to $69,000. But despite this, the asset failed to break through the $70,000 mark, which also caused a local price reversal. However, the main catalyst for the fall in the BTC price was the excitement in related markets caused by the latest rumors about the bankruptcy of the Chinese developer Evergrande. Yesterday, the company had to pay more than $145 million in interest on securities but did not do it on time, which meant the actual onset of bankruptcy. The market began an immediate reaction to the unverified news, which triggered a correction. Given the fact that the last HANDICAP was established in correlation with the indices of the US financial markets, the price decline and excitement spread to the neighboring market.

However, the news turned out to be fake. The developer made the payment, as reported by representatives of creditors. Despite this, Bitcoin quotes collapsed by 9%, namely from $69k to $62k, which led to the mass liquidation of positions. The total amount of liquidated positions was $700 million, and the largest order was opened in the amount of $65 million paired with ADA. Bitcoin's decline caused a chain reaction, and the entire cryptocurrency market was in the red zone. The total capitalization of all assets fell to $2.86 trillion, and the bitcoin price recovered to $65,200. The price made a rebound from the local support zone at $62,700, after which it hesitantly recovered to the current values.

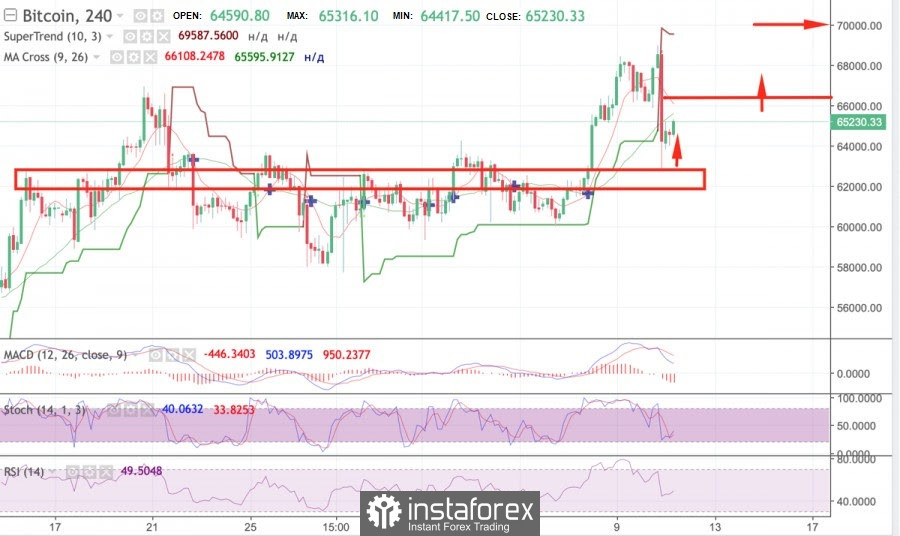
On the four-hour chart, BTC plunged beyond the super trend line, but it is not worth taking this as a change in the medium-term direction of price movement, since the collapse was the result of the impulsive behavior of the players. Now, overcoming the psychological level of $70,00 is postponed due to the need for a local recovery period, which may take some time. In addition to the ATH levels, the price will meet resistance at $66,400 and $68,00. An uncertain red "doji" candle formed on the chart, which meant the interception of the initiative by the bulls, which was reflected in the technical indicators. The stochastic oscillator began an upward movement after the formation of a bullish intersection, and the relative strength index is moving towards the 60 mark within the bullish zone, which indicates an increase in buyer interest. At the same time, there is a downward signal expressed in the divergence between the price movement and the MACD oscillator. Given this, a local pullback at $66,400 can be assumed.

This image is no longer relevant

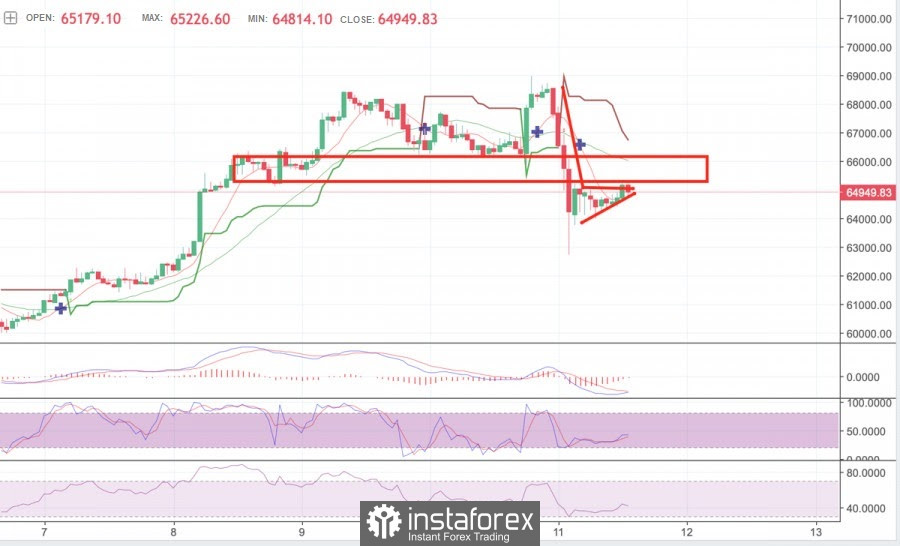
As for the hourly chart, Bitcoin has exhausted the local bullish momentum, which is expressed in the formation of a red candle after a series of uncertain green ones. This is also due to the approach to the local resistance level at $65,247. In addition, a technical analysis figure has formed on the charts. There will be a bullish pennant with an upward compression, at the breakdown of which the price can receive an additional upward impulse. The bullish breakdown of this local pattern is important for further recovery, as technical indicators indicate the weakness of buyers: MACD and stochastic are moving flat and can make a reversal in any direction, and the relative strength index is declining to around 40. The breakdown of the pennant will set the dynamics of the price movement for the next few hours, and the approximate recovery rates will be clear from it, other things being equal in the market.

This image is no longer relevant

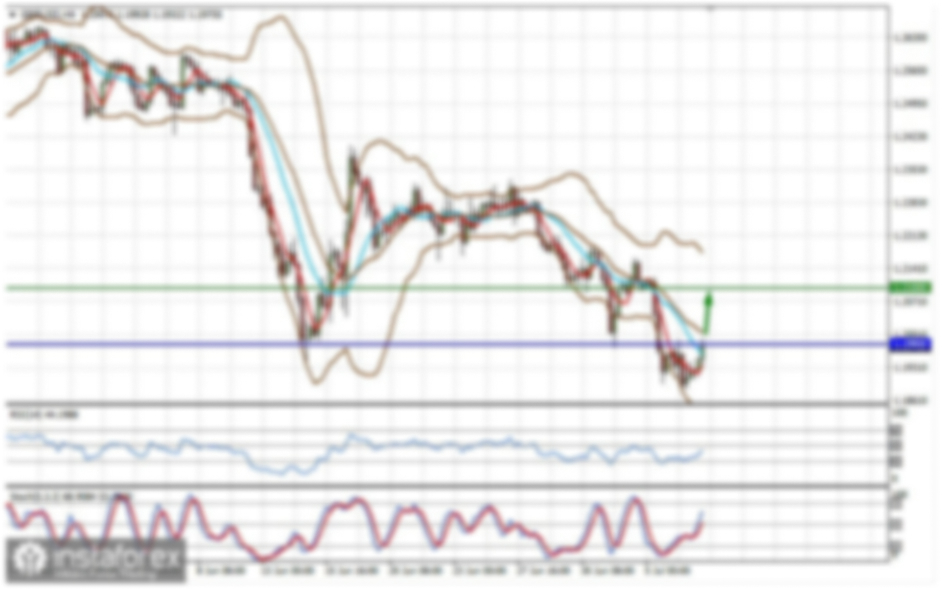
The "head and shoulders" technical analysis figure was formed on the daily chart, indicating a trend reversal, which is a bearish signal to retest key support levels. This is indicated by technical indicators: the MACD began to decline after the formation of a local bearish intersection, but the stochastic and the relative strength index begin to align and move flat. Despite this, the formation of a full-fledged bearish pattern indicates a further decline in the price. The nearest support zones are located at the levels of $64,400, $58,000, and $53,600.

This image is no longer relevant

Artem Petrenko,
Analytical expert of InstaForex
© 2007-2025
Summary
Urgency
Analytic
Artem Petrenko
Start trade
Earn on cryptocurrency rate changes with InstaForex
Download MetaTrader 4 and open your first trade
  • Grand Choice
    Contest by
    InstaForex
    InstaForex always strives to help you
    fulfill your biggest dreams.
    JOIN CONTEST

Recommended Stories

Bitcoin touches $117,500

During this morning's session, Bitcoin updated its level to $117,500. The key task for buyers now will be to keep trading above the $116,000 mark. Ethereum also refreshed its high

Jakub Novak 11:44 2025-08-08 UTC+2

Trading Recommendations for the Cryptocurrency Market on August 8

Earlier this week, many were worried that Bitcoin might plunge sharply toward the 110,000 level, fearing a deeper correction toward 100,000. However, market sentiment has since shifted in the opposite

Miroslaw Bawulski 09:07 2025-08-08 UTC+2

Cardano has the potential for a correction to test its pivot level in the near future. Friday, August 08, 2025.

Cardano – Friday, August 08, 2025. With the EMA(50) positioned above the EMA(200) and the RSI(14) indicator in Extreme-Bullish conditions, it appears that buyers are currently dominant. However, the appearance

Arief Makmur 07:39 2025-08-08 UTC+2

Despite the potential for a correction, Uniswap still has a healthy bullish bias. Friday, August 08, 2025.

Uniswap – Friday, August 08, 2025. The Golden Cross condition of both EMAs and the RSI(14) in the Neutral-Bullish area indicates potential for strengthening today. However, the appearance

Arief Makmur 07:39 2025-08-08 UTC+2

Trading Recommendations for the Cryptocurrency Market on August 7

Bitcoin remains within a newly formed sideways channel, once again attempting yesterday to break above the 115,500 level. Ethereum also shows resilience, which is confirmed by recent activity metrics

Miroslaw Bawulski 08:48 2025-08-07 UTC+2

SEC no longer considers staking offer or sale of securities

Bitcoin is hitting lows more often than it is reaching local highs. Every major rally is followed by slow and steady sell-offs, a pattern that suggests a broader crypto market

Jakub Novak 11:28 2025-08-06 UTC+2

Trading Recommendations for the Cryptocurrency Market on August 6

Bitcoin continues to trade within a new sideways channel, and its inability to hold above $115,000 indicates a high likelihood of continued correction. Another decline toward the $112,000 level

Miroslaw Bawulski 09:14 2025-08-06 UTC+2

Trading Recommendations for the Cryptocurrency Market on August 5

Yesterday's failure to break above the $115,000 level—even amid a strong correction observed in the second half of the day—suggests that Bitcoin's decline may continue and that larger pullbacks toward

Miroslaw Bawulski 09:03 2025-08-05 UTC+2

Trading Recommendations for the Cryptocurrency Market on August 4

Bitcoin and Ethereum started August on a rather bearish note. Following a sharp drop in the U.S. stock market last Friday, the cryptocurrency market also moved downward, once again demonstrating

Miroslaw Bawulski 09:28 2025-08-04 UTC+2

Trading Recommendations for the Cryptocurrency Market on August 1

Bitcoin and Ethereum saw a significant decline, ending the month with profit-taking. Despite the correction, July was fairly positive—especially for Ethereum, which gained over 49% in price. Bitcoin rose

Miroslaw Bawulski 09:34 2025-08-01 UTC+2
Can't speak right now?
Ask your question in the chat.
Widget callback
 

Dear visitor,

Your IP address shows that you are currently located in the USA. If you are a resident of the United States, you are prohibited from using the services of InstaFintech Group including online trading, online transfers, deposit/withdrawal of funds, etc.

If you think you are seeing this message by mistake and your location is not the US, kindly proceed to the website. Otherwise, you must leave the website in order to comply with government restrictions.

Why does your IP address show your location as the USA?

  • - you are using a VPN provided by a hosting company based in the United States;
  • - your IP does not have proper WHOIS records;
  • - an error occurred in the WHOIS geolocation database.

Please confirm whether you are a US resident or not by clicking the relevant button below. If you choose the wrong option, being a US resident, you will not be able to open an account with InstaForex anyway.

We are sorry for any inconvenience caused by this message.