

signal strength 1 of 5

The technical pattern called Head and Shoulders has appeared on the chart of GOLD M5. There are weighty reasons to suggest that the price will surpass the Neckline 3473.12/3476.36 after the right shoulder has been formed. So, the trend is set to change with the price heading for 3476.21.
The M5 and M15 time frames may have more false entry points.
আরও দেখুন
- All
- Double Top
- Flag
- Head and Shoulders
- Pennant
- Rectangle
- Triangle
- Triple top
- All
- #AAPL
- #AMZN
- #Bitcoin
- #EBAY
- #FB
- #GOOG
- #INTC
- #KO
- #MA
- #MCD
- #MSFT
- #NTDOY
- #PEP
- #TSLA
- #TWTR
- AUDCAD
- AUDCHF
- AUDJPY
- AUDUSD
- EURCAD
- EURCHF
- EURGBP
- EURJPY
- EURNZD
- EURRUB
- EURUSD
- GBPAUD
- GBPCHF
- GBPJPY
- GBPUSD
- GOLD
- NZDCAD
- NZDCHF
- NZDJPY
- NZDUSD
- SILVER
- USDCAD
- USDCHF
- USDJPY
- USDRUB
- All
- M5
- M15
- M30
- H1
- D1
- All
- Buy
- Sale
- All
- 1
- 2
- 3
- 4
- 5
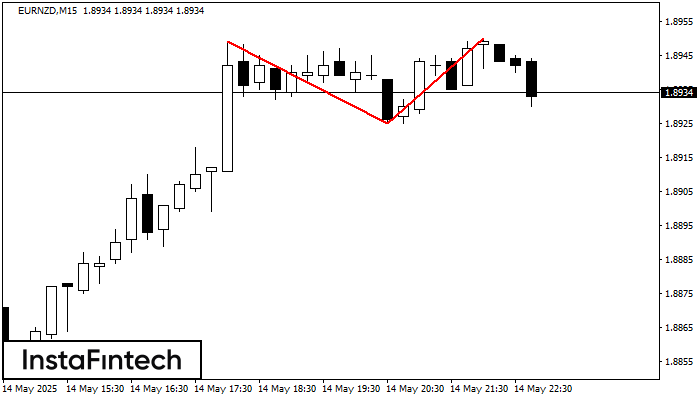
On the chart of EURNZD M15 the Double Top reversal pattern has been formed. Characteristics: the upper boundary 1.8950; the lower boundary 1.8925; the width of the pattern 25 points
The M5 and M15 time frames may have more false entry points.
Open chart in a new window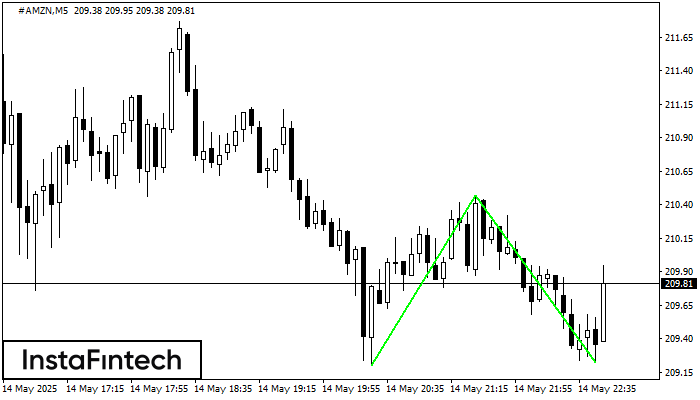
The Double Bottom pattern has been formed on #AMZN M5; the upper boundary is 210.47; the lower boundary is 209.22. The width of the pattern is 127 points. In case
The M5 and M15 time frames may have more false entry points.
Open chart in a new window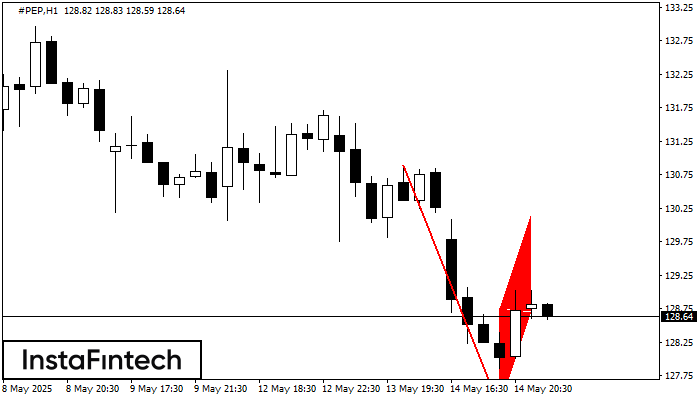
The Bearish Flag pattern has been formed on #PEP at H1. The lower boundary of the pattern is located at 127.29/128.71 while the upper boundary lies at 128.75/130.17. The projection
Open chart in a new window


