

signal strength 1 of 5
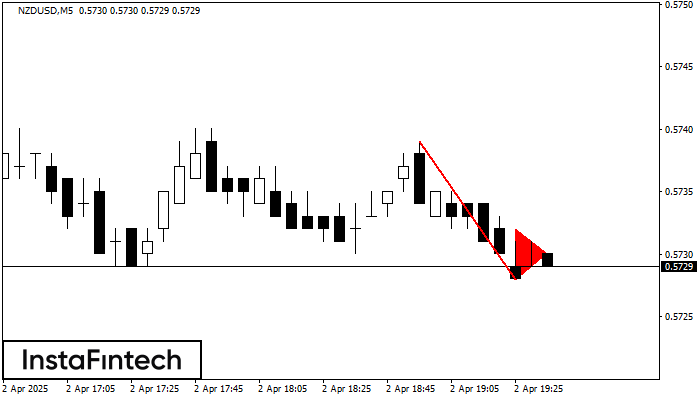
The Bearish pennant pattern has formed on the NZDUSD M5 chart. The pattern signals continuation of the downtrend in case the pennant’s low of 0.5728 is broken through. Recommendations: Place the sell stop pending order 10 pips below the pattern’s low. Place the take profit order at the projection distance of the flagpole height.
The M5 and M15 time frames may have more false entry points.
- All
- Double Top
- Flag
- Head and Shoulders
- Pennant
- Rectangle
- Triangle
- Triple top
- All
- #AAPL
- #AMZN
- #Bitcoin
- #EBAY
- #FB
- #GOOG
- #INTC
- #KO
- #MA
- #MCD
- #MSFT
- #NTDOY
- #PEP
- #TSLA
- #TWTR
- AUDCAD
- AUDCHF
- AUDJPY
- AUDUSD
- EURCAD
- EURCHF
- EURGBP
- EURJPY
- EURNZD
- EURRUB
- EURUSD
- GBPAUD
- GBPCHF
- GBPJPY
- GBPUSD
- GOLD
- NZDCAD
- NZDCHF
- NZDJPY
- NZDUSD
- SILVER
- USDCAD
- USDCHF
- USDJPY
- USDRUB
- All
- M5
- M15
- M30
- H1
- D1
- All
- Buy
- Sale
- All
- 1
- 2
- 3
- 4
- 5
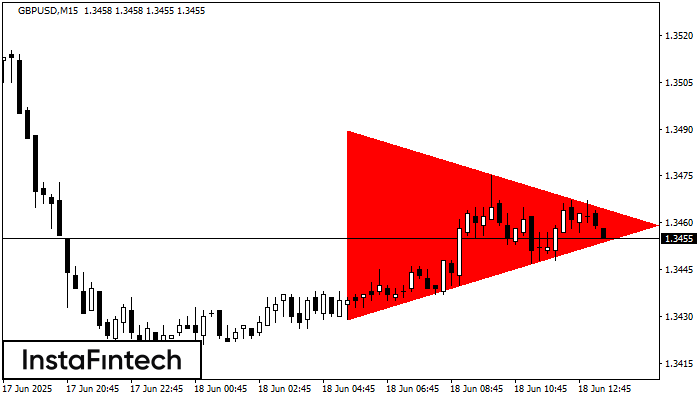
According to the chart of M15, GBPUSD formed the Bearish Symmetrical Triangle pattern. This pattern signals a further downward trend in case the lower border 1.3429 is breached. Here
The M5 and M15 time frames may have more false entry points.
Open chart in a new window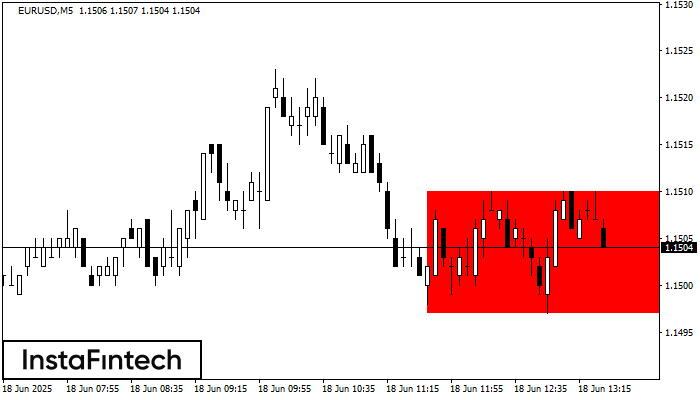
According to the chart of M5, EURUSD formed the Bearish Rectangle. The pattern indicates a trend continuation. The upper border is 1.1510, the lower border is 1.1497. The signal means
The M5 and M15 time frames may have more false entry points.
Open chart in a new window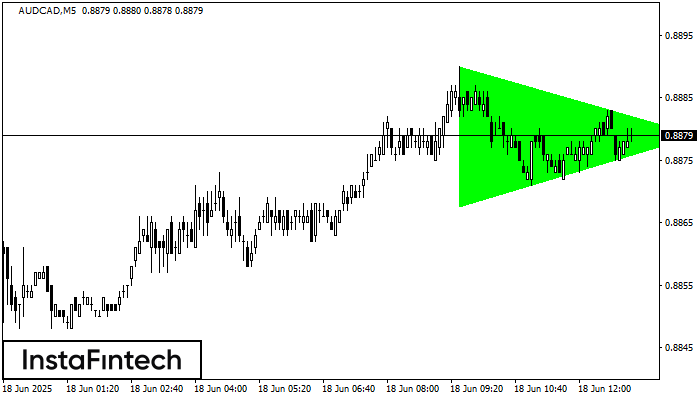
According to the chart of M5, AUDCAD formed the Bullish Symmetrical Triangle pattern. Description: This is the pattern of a trend continuation. 0.8890 and 0.8868 are the coordinates
The M5 and M15 time frames may have more false entry points.
Open chart in a new window


