

signal strength 1 of 5
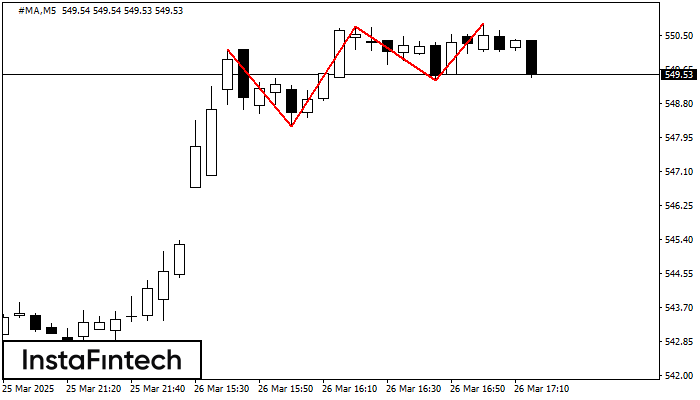
The Triple Top pattern has formed on the chart of the #MA M5 trading instrument. It is a reversal pattern featuring the following characteristics: resistance level -66, support level -113, and pattern’s width 192. Forecast If the price breaks through the support level 548.24, it is likely to move further down to 550.59.
The M5 and M15 time frames may have more false entry points.
- All
- Double Top
- Flag
- Head and Shoulders
- Pennant
- Rectangle
- Triangle
- Triple top
- All
- #AAPL
- #AMZN
- #Bitcoin
- #EBAY
- #FB
- #GOOG
- #INTC
- #KO
- #MA
- #MCD
- #MSFT
- #NTDOY
- #PEP
- #TSLA
- #TWTR
- AUDCAD
- AUDCHF
- AUDJPY
- AUDUSD
- EURCAD
- EURCHF
- EURGBP
- EURJPY
- EURNZD
- EURRUB
- EURUSD
- GBPAUD
- GBPCHF
- GBPJPY
- GBPUSD
- GOLD
- NZDCAD
- NZDCHF
- NZDJPY
- NZDUSD
- SILVER
- USDCAD
- USDCHF
- USDJPY
- USDRUB
- All
- M5
- M15
- M30
- H1
- D1
- All
- Buy
- Sale
- All
- 1
- 2
- 3
- 4
- 5

Mô hình Cờ hiệu giảm đã được hình thành trên biểu đồ #NTDOY M30. Mô hình này báo hiệu sự tiếp tục của xu hướng giảm trong trường
Open chart in a new window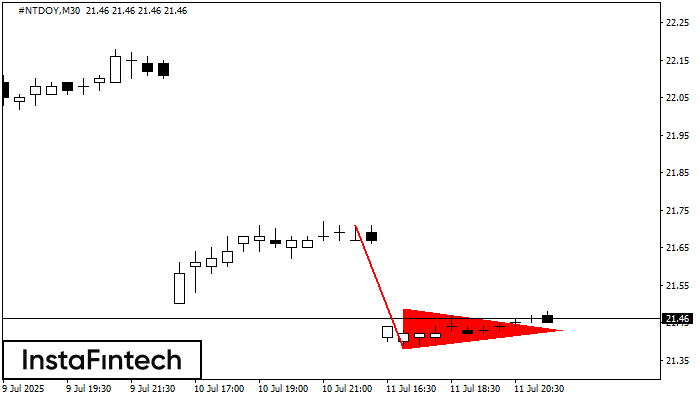
Mô hình Cờ hiệu giảm đã được hình thành trên biểu đồ #NTDOY M30. Mô hình này báo hiệu sự tiếp tục của xu hướng giảm trong trường
Open chart in a new window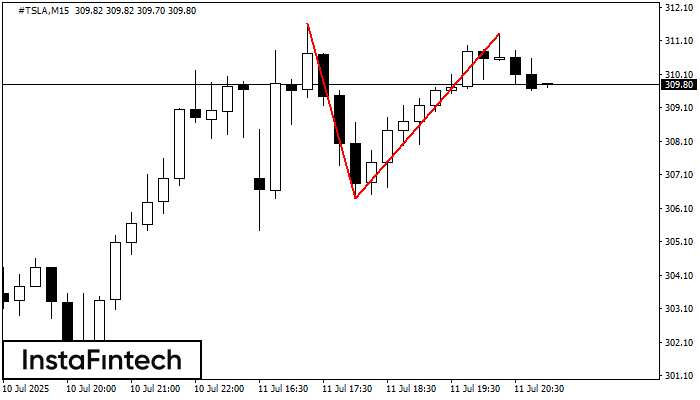
Trên biểu đồ #TSLA M15, mô hình đảo chiều Đỉnh đôi đã được hình thành. Đặc điểm: ranh giới trên ở 311.31; ranh giới dưới ở 306.40; chiều rộng
Khung thời gian M5 và M15 có thể có nhiều điểm vào lệnh sai hơn.
Open chart in a new window


