


signal strength 1 of 5

The Double Bottom pattern has been formed on #Bitcoin M5. Characteristics: the support level 83931.70; the resistance level 84051.13; the width of the pattern 11943 points. If the resistance level is broken, a change in the trend can be predicted with the first target point lying at the distance of 10667 points.
The M5 and M15 time frames may have more false entry points.
আরও দেখুন
- All
- Double Top
- Flag
- Head and Shoulders
- Pennant
- Rectangle
- Triangle
- Triple top
- All
- #AAPL
- #AMZN
- #Bitcoin
- #EBAY
- #FB
- #GOOG
- #INTC
- #KO
- #MA
- #MCD
- #MSFT
- #NTDOY
- #PEP
- #TSLA
- #TWTR
- AUDCAD
- AUDCHF
- AUDJPY
- AUDUSD
- EURCAD
- EURCHF
- EURGBP
- EURJPY
- EURNZD
- EURRUB
- EURUSD
- GBPAUD
- GBPCHF
- GBPJPY
- GBPUSD
- GOLD
- NZDCAD
- NZDCHF
- NZDJPY
- NZDUSD
- SILVER
- USDCAD
- USDCHF
- USDJPY
- USDRUB
- All
- M5
- M15
- M30
- H1
- D1
- All
- Buy
- Sale
- All
- 1
- 2
- 3
- 4
- 5
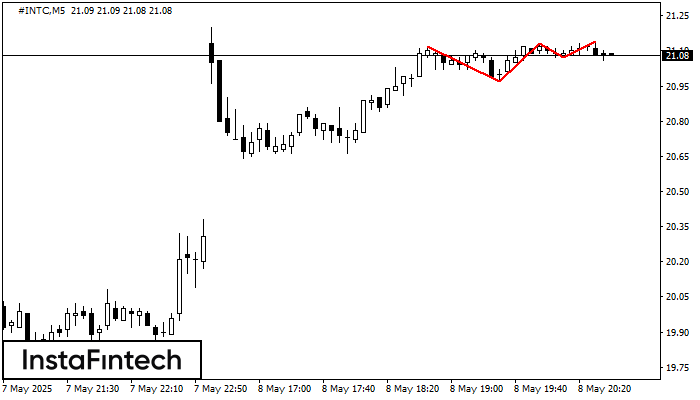
รูปแบบ รูปแบบกราฟจุดสามยอด (Triple Top) ได้สร้างขึ้นมาในชาร์ตของ #INTC M5 คุณลักษณะของกราฟรูปแบบนี้: ขอบเขตมีมุมหงายขึ้น; เส้นด้านล่างของกราฟรูปแบบนี้มีพิกัดอยู่ที่ 20.97/21.07 พร้อมกับลิมิตขาขึ้น 21.12/21.14; ระยะของความกว้างคือ
ขอบเตระยะเวลาใน M5 และ M15 อาจจะมีตำแหน่งการเข้าใช้งานที่ผิดพลาดมากยิ่งขึ้น
Open chart in a new windowwas formed on 08.05 at 19:25:47 (UTC+0)
signal strength 1 of 5
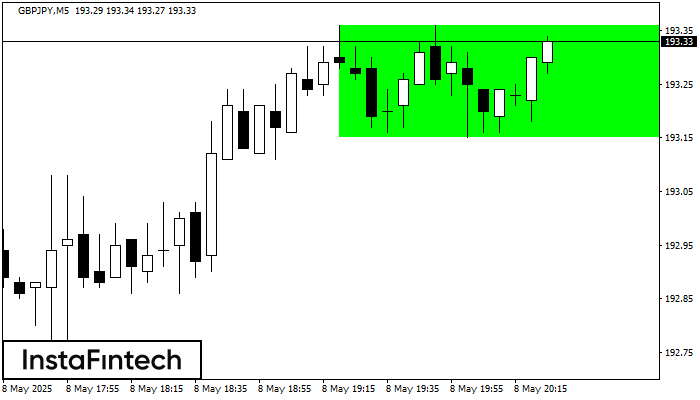
อ้างอิงจากชาร์ตของ M5, GBPJPY ที่ได้สร้างรูปแบบ รูปแบบกราฟสี่เหลี่ยมผืนผ้าขาขึ้น (Bullish Rectangle) ออกมา รูปแบบนี้แสดงถึง ความต่อเนื่องในแนวโน้ม ขอบเขตด้านบนคือ 193.36 ส่วน ขอบเขตด้านล่างคือ 193.15
ขอบเตระยะเวลาใน M5 และ M15 อาจจะมีตำแหน่งการเข้าใช้งานที่ผิดพลาดมากยิ่งขึ้น
Open chart in a new windowwas formed on 08.05 at 19:20:20 (UTC+0)
signal strength 1 of 5
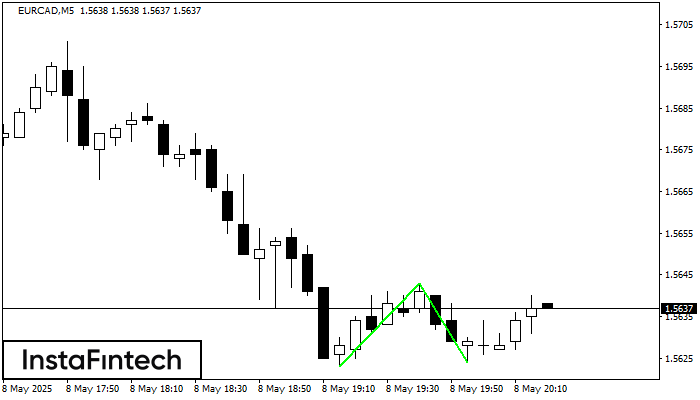
รูปแบบ รูปแบบกราฟจุดสองยอดขาลง (Double Bottom) ถูกสร้างขึ้นมาใน EURCAD M5; ขอบเขตด้านบนอยู่ที่ 1.5643;ขอบเขตด้านล่าง คือ 1.5624 ความกว้างของรูปแบบนี้คือ 20 จุด กรณีที่มีการเคลื่อนตัวทะลุผ่านขอบเขตด้านบน
ขอบเตระยะเวลาใน M5 และ M15 อาจจะมีตำแหน่งการเข้าใช้งานที่ผิดพลาดมากยิ่งขึ้น
Open chart in a new window


