

signal strength 2 of 5
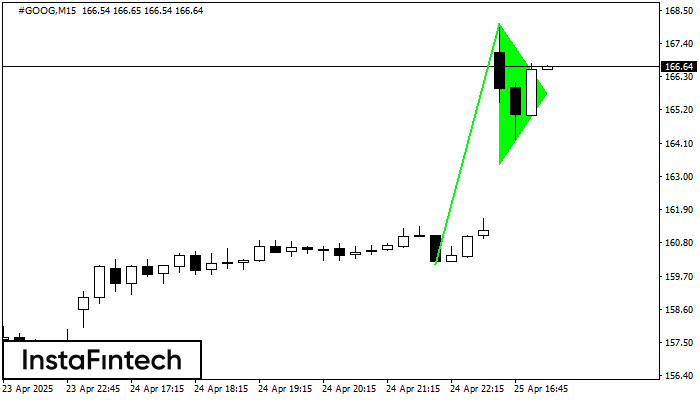
The Bullish pennant signal – Trading instrument #GOOG M15, continuation pattern. Forecast: it is possible to set up a buy position above the pattern’s high of 168.07, with the prospect of the next move being a projection of the flagpole height.
The M5 and M15 time frames may have more false entry points.
- All
- Double Top
- Flag
- Head and Shoulders
- Pennant
- Rectangle
- Triangle
- Triple top
- All
- #AAPL
- #AMZN
- #Bitcoin
- #EBAY
- #FB
- #GOOG
- #INTC
- #KO
- #MA
- #MCD
- #MSFT
- #NTDOY
- #PEP
- #TSLA
- #TWTR
- AUDCAD
- AUDCHF
- AUDJPY
- AUDUSD
- EURCAD
- EURCHF
- EURGBP
- EURJPY
- EURNZD
- EURRUB
- EURUSD
- GBPAUD
- GBPCHF
- GBPJPY
- GBPUSD
- GOLD
- NZDCAD
- NZDCHF
- NZDJPY
- NZDUSD
- SILVER
- USDCAD
- USDCHF
- USDJPY
- USDRUB
- All
- M5
- M15
- M30
- H1
- D1
- All
- Buy
- Sale
- All
- 1
- 2
- 3
- 4
- 5
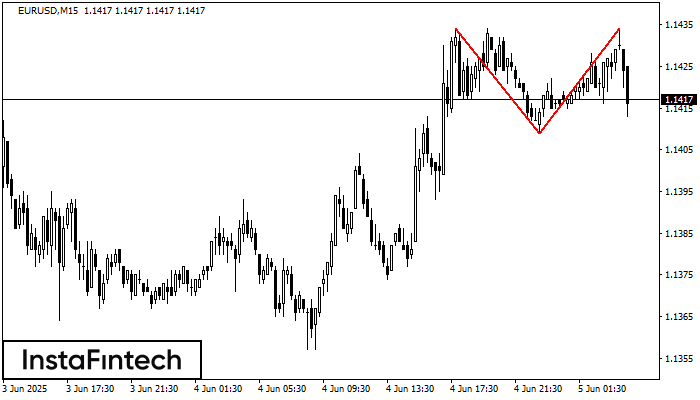
The Double Top pattern has been formed on EURUSD M15. It signals that the trend has been changed from upwards to downwards. Probably, if the base of the pattern 1.1409
The M5 and M15 time frames may have more false entry points.
Open chart in a new window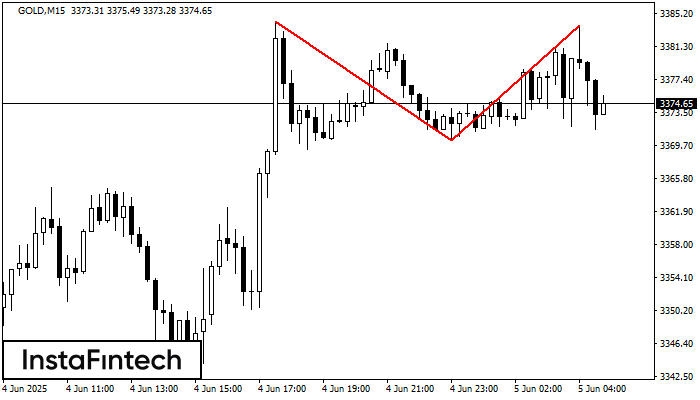
The Double Top reversal pattern has been formed on GOLD M15. Characteristics: the upper boundary 3384.23; the lower boundary 3370.26; the width of the pattern is 1346 points. Sell trades
The M5 and M15 time frames may have more false entry points.
Open chart in a new window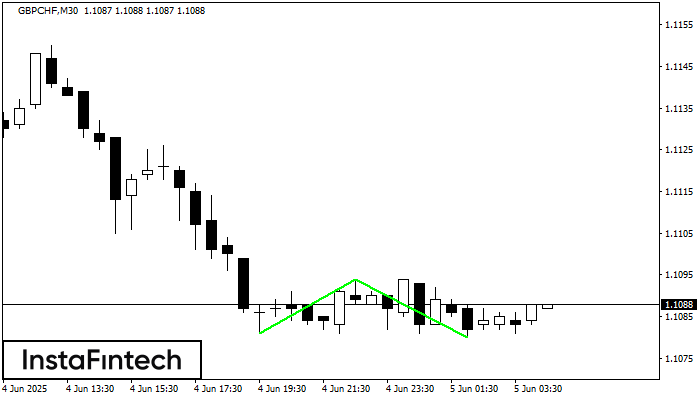
The Double Bottom pattern has been formed on GBPCHF M30. This formation signals a reversal of the trend from downwards to upwards. The signal is that a buy trade should
Open chart in a new window


