


signal strength 2 of 5

The Triple Bottom pattern has been formed on #AAPL M15. It has the following characteristics: resistance level 191.73/191.10; support level 189.80/190.18; the width is 193 points. In the event of a breakdown of the resistance level of 191.73, the price is likely to continue an upward movement at least to 190.34.
The M5 and M15 time frames may have more false entry points.
انظر أيضا
- All
- Double Top
- Flag
- Head and Shoulders
- Pennant
- Rectangle
- Triangle
- Triple top
- All
- #AAPL
- #AMZN
- #Bitcoin
- #EBAY
- #FB
- #GOOG
- #INTC
- #KO
- #MA
- #MCD
- #MSFT
- #NTDOY
- #PEP
- #TSLA
- #TWTR
- AUDCAD
- AUDCHF
- AUDJPY
- AUDUSD
- EURCAD
- EURCHF
- EURGBP
- EURJPY
- EURNZD
- EURRUB
- EURUSD
- GBPAUD
- GBPCHF
- GBPJPY
- GBPUSD
- GOLD
- NZDCAD
- NZDCHF
- NZDJPY
- NZDUSD
- SILVER
- USDCAD
- USDCHF
- USDJPY
- USDRUB
- All
- M5
- M15
- M30
- H1
- D1
- All
- Buy
- Sale
- All
- 1
- 2
- 3
- 4
- 5
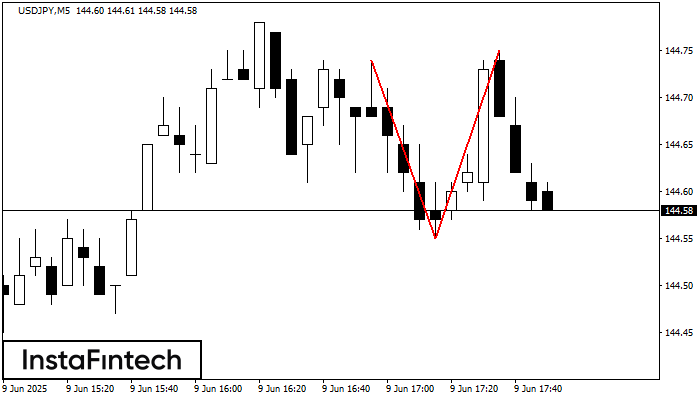
The Double Top reversal pattern has been formed on USDJPY M5. Characteristics: the upper boundary 144.74; the lower boundary 144.55; the width of the pattern is 20 points. Sell trades
The M5 and M15 time frames may have more false entry points.
Open chart in a new window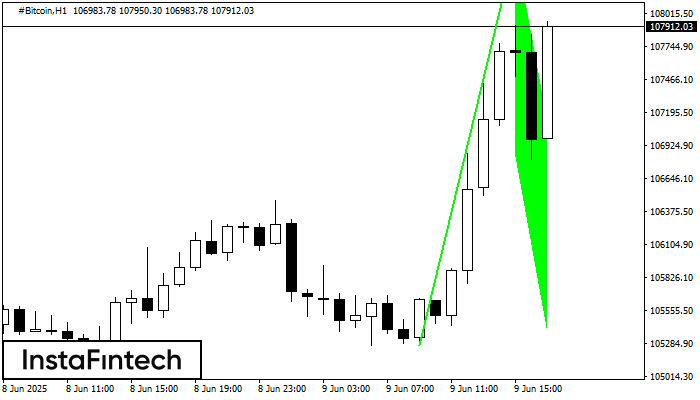
The Bullish Flag pattern which signals continuation of a trend has been formed on the chart #Bitcoin H1. Forecast: if the price breaks above the pattern high at 108563.52, then
Open chart in a new window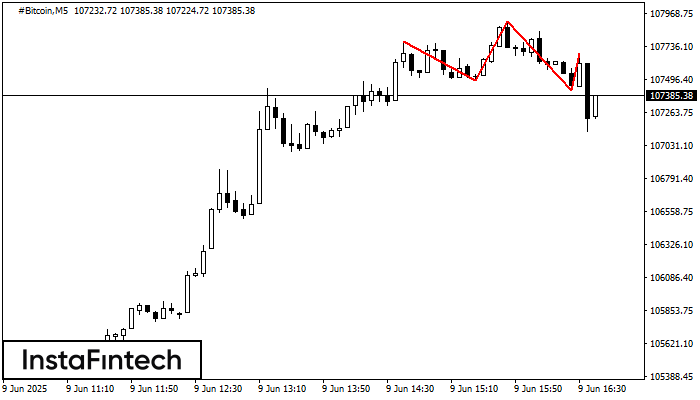
The #Bitcoin M5 formed the Head and Shoulders pattern with the following features: The Head’s top is at 107912.77, the Neckline and the upward angle are at 107491.49/107422.45. The formation
The M5 and M15 time frames may have more false entry points.
Open chart in a new window


