

signal strength 2 of 5

The Triple Top pattern has formed on the chart of the EURUSD M15. Features of the pattern: borders have an ascending angle; the lower line of the pattern has the coordinates 1.1387/1.1391 with the upper limit 1.1397/1.1397; the projection of the width is 10 points. The formation of the Triple Top figure most likely indicates a change in the trend from upward to downward. This means that in the event of a breakdown of the support level of 1.1387, the price is most likely to continue the downward movement.
The M5 and M15 time frames may have more false entry points.
انظر أيضا
- All
- Double Top
- Flag
- Head and Shoulders
- Pennant
- Rectangle
- Triangle
- Triple top
- All
- #AAPL
- #AMZN
- #Bitcoin
- #EBAY
- #FB
- #GOOG
- #INTC
- #KO
- #MA
- #MCD
- #MSFT
- #NTDOY
- #PEP
- #TSLA
- #TWTR
- AUDCAD
- AUDCHF
- AUDJPY
- AUDUSD
- EURCAD
- EURCHF
- EURGBP
- EURJPY
- EURNZD
- EURRUB
- EURUSD
- GBPAUD
- GBPCHF
- GBPJPY
- GBPUSD
- GOLD
- NZDCAD
- NZDCHF
- NZDJPY
- NZDUSD
- SILVER
- USDCAD
- USDCHF
- USDJPY
- USDRUB
- All
- M5
- M15
- M30
- H1
- D1
- All
- Buy
- Sale
- All
- 1
- 2
- 3
- 4
- 5
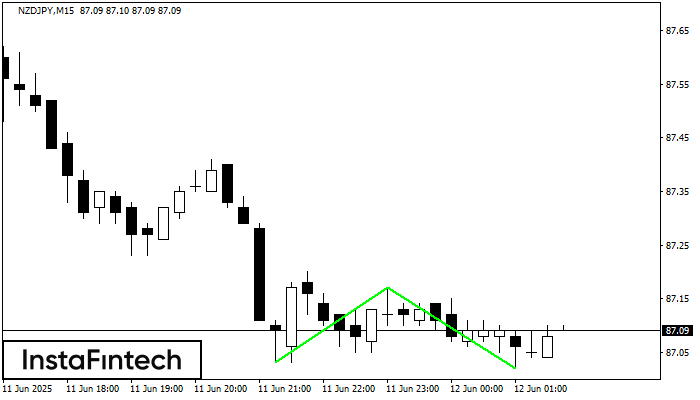
The Double Bottom pattern has been formed on NZDJPY M15; the upper boundary is 87.17; the lower boundary is 87.02. The width of the pattern is 14 points. In case
The M5 and M15 time frames may have more false entry points.
Open chart in a new window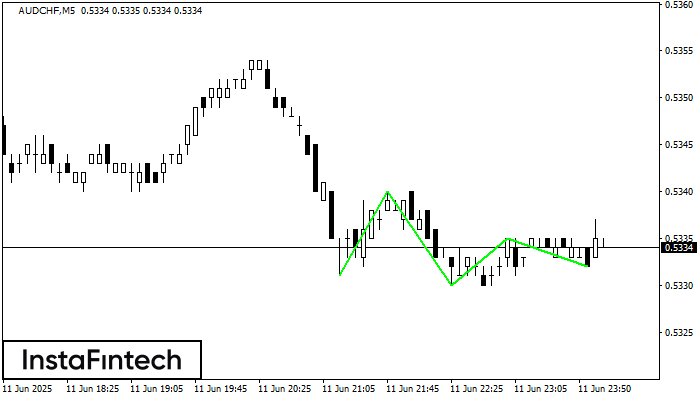
The Triple Bottom pattern has been formed on AUDCHF M5. It has the following characteristics: resistance level 0.5340/0.5335; support level 0.5331/0.5332; the width is 9 points. In the event
The M5 and M15 time frames may have more false entry points.
Open chart in a new window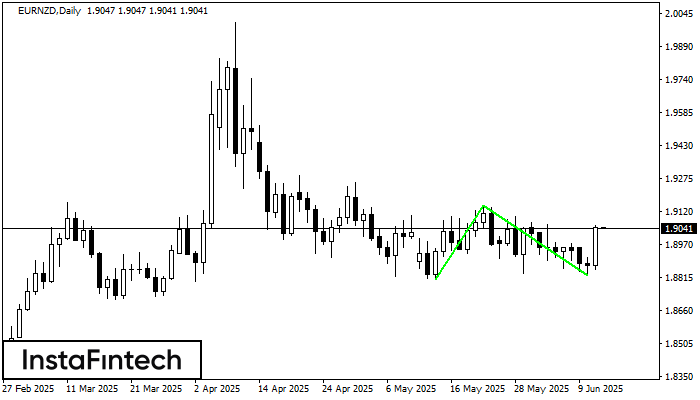
The Double Bottom pattern has been formed on EURNZD D1. Characteristics: the support level 1.8805; the resistance level 1.9150; the width of the pattern 345 points. If the resistance level
Open chart in a new window


