


signal strength 1 of 5
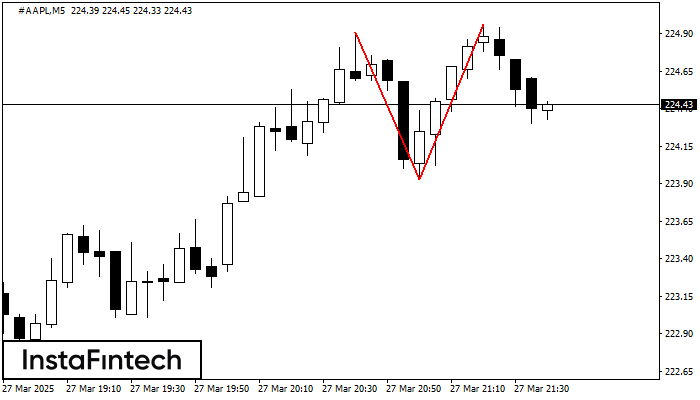
The Double Top pattern has been formed on #AAPL M5. It signals that the trend has been changed from upwards to downwards. Probably, if the base of the pattern 223.93 is broken, the downward movement will continue.
The M5 and M15 time frames may have more false entry points.
انظر أيضا
- All
- Double Top
- Flag
- Head and Shoulders
- Pennant
- Rectangle
- Triangle
- Triple top
- All
- #AAPL
- #AMZN
- #Bitcoin
- #EBAY
- #FB
- #GOOG
- #INTC
- #KO
- #MA
- #MCD
- #MSFT
- #NTDOY
- #PEP
- #TSLA
- #TWTR
- AUDCAD
- AUDCHF
- AUDJPY
- AUDUSD
- EURCAD
- EURCHF
- EURGBP
- EURJPY
- EURNZD
- EURRUB
- EURUSD
- GBPAUD
- GBPCHF
- GBPJPY
- GBPUSD
- GOLD
- NZDCAD
- NZDCHF
- NZDJPY
- NZDUSD
- SILVER
- USDCAD
- USDCHF
- USDJPY
- USDRUB
- All
- M5
- M15
- M30
- H1
- D1
- All
- Buy
- Sale
- All
- 1
- 2
- 3
- 4
- 5
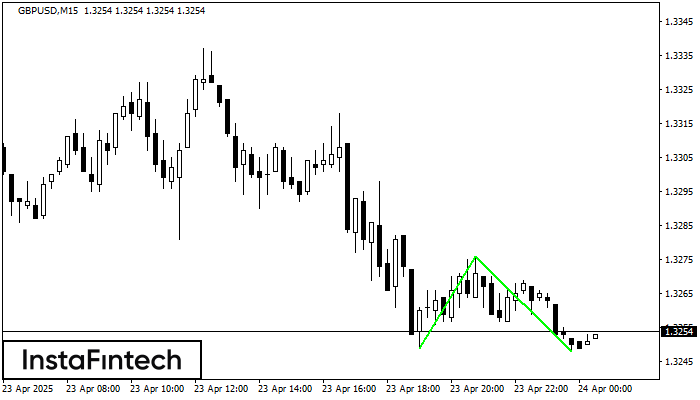
The Double Bottom pattern has been formed on GBPUSD M15. This formation signals a reversal of the trend from downwards to upwards. The signal is that a buy trade should
The M5 and M15 time frames may have more false entry points.
Open chart in a new window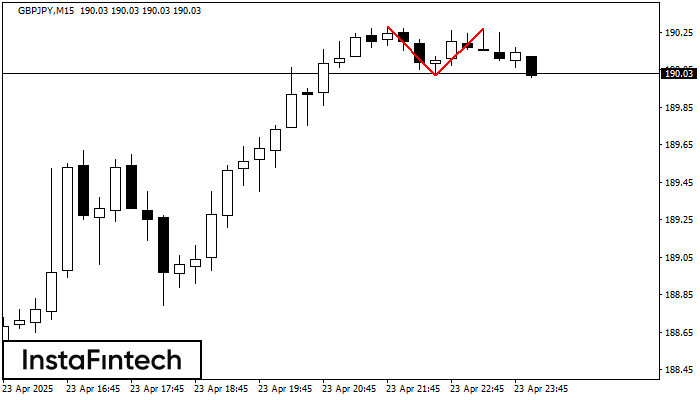
The Double Top reversal pattern has been formed on GBPJPY M15. Characteristics: the upper boundary 190.28; the lower boundary 190.02; the width of the pattern is 25 points. Sell trades
The M5 and M15 time frames may have more false entry points.
Open chart in a new window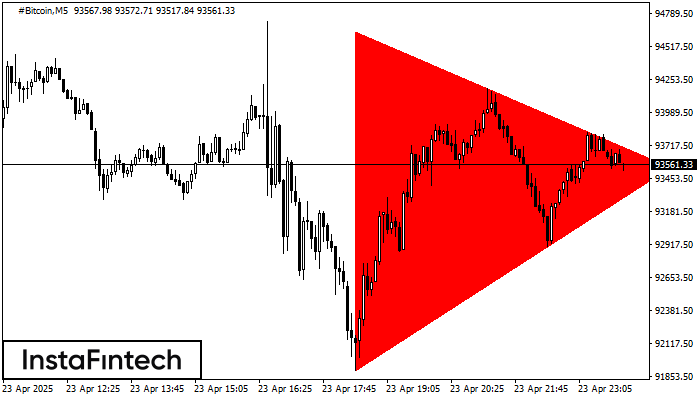
According to the chart of M5, #Bitcoin formed the Bearish Symmetrical Triangle pattern. Trading recommendations: A breach of the lower border 91900.13 is likely to encourage a continuation
The M5 and M15 time frames may have more false entry points.
Open chart in a new window


