empty
13.11.2023 12:32 PM
EUR/USD and GBP/USD: Trading plan for beginner traders on November 13, 2023

Details of the Economic Calendar on November 10

Industrial production data in the UK remained at the level of 1.5% despite expectations of a decline. However, the previous indicator was revised in favor of growth, from 1.3% to 1.5%, and the actual figures came in at 1.5% instead of 1.1% (YoY).

Analysis of Trading Charts from November 10

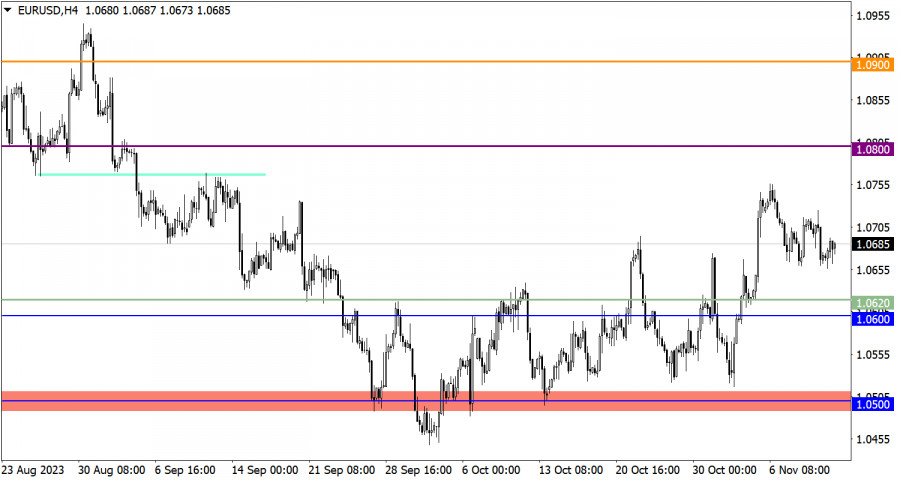
The EUR/USD currency pair slowed its decline and did not reach the 1.0650 mark. In fact, starting from the middle of last week, the quote has been in a conditional sideways range.

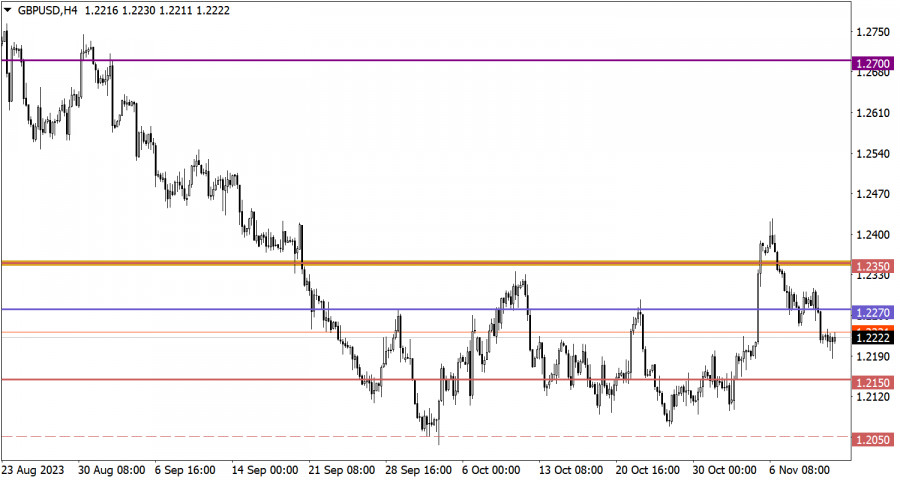
As for the GBP/USD pair, it temporarily dropped below the level of 1.2200, but then there was a reduction in the volume of short positions. As a result, the week ended with the formation of a two-digit doji candle, indicating a slowdown in the downward trend.

This image is no longer relevant

Economic Calendar for November 13

Monday, as usual, is accompanied by an empty macroeconomic calendar. No releases of important statistical data are expected in the European Union, the United Kingdom, and the United States.

In connection with this, investors and traders are likely to rely on the incoming news flow to make decisions in the market.

EUR/USD Trading Plan for November 13

In this situation, we have two key levels: the first is at 1.0650, which is considered in a downward scenario, and the second is at 1.0750. A breakout of the 1.0750 mark would indicate a continuation of the upward cycle.

This image is no longer relevant

GBP/USD Trading Plan for November 13

For further depreciation of the pound sterling, it is necessary for the price to stay below the level of 1.2200. In this case, we can expect a movement towards 1.2150.

As for the upward scenario, it is considered as a partial recovery of the value of the pound, taking into account the local oversold condition in short-term time periods. The level of 1.2200 can serve as a variable support, and if the price holds above this level, we can expect a gradual recovery of the quote above the value of 1.2270.

This image is no longer relevant

What's on the charts

The candlestick chart type is white and black graphic rectangles with lines above and below. With a detailed analysis of each individual candle, you can see its characteristics relative to a particular time frame: opening price, closing price, intraday high and low.

Horizontal levels are price coordinates, relative to which a price may stop or reverse its trajectory. In the market, these levels are called support and resistance.

Circles and rectangles are highlighted examples where the price reversed in history. This color highlighting indicates horizontal lines that may put pressure on the asset's price in the future.

The up/down arrows are landmarks of the possible price direction in the future.

Gven Podolsky,
الخبير التحليلي لدى شركة إنستافوركس
© 2007-2025
حدد الإطار الزمني
5
د
15
د
30
د
1
س
4
ساعات
1
يوم
1
أسبوع
كسب عائد من تغيرات أسعار العملات المشفرة مع إنستافوركس.
قم بتحميل منصة التداول ميتاتريدر 4 وافتح أول صفقة.
  • Grand Choice
    Contest by
    InstaForex
    InstaForex always strives to help you
    fulfill your biggest dreams.
    انضم إلى المسابقة

المقالات الموصى بها

كيفية تداول زوج العملات GBP/USD في 9 يوليو: نصائح بسيطة وتحليل التداول للمبتدئين

في يوم الثلاثاء، واصل زوج الجنيه الإسترليني/الدولار الأمريكي حركته الهبوطية المعتدلة، والتي تبدو بوضوح ذات طبيعة فنية وتصحيحية. لم تكن هناك أي أحداث اقتصادية كبرى في كل من الولايات المتحدة

Paolo Greco 08:46 2025-07-09 UTC+2

كيف تتداول زوج العملات EUR/USD في 9 يوليو؟ نصائح بسيطة وتحليل التداول للمبتدئين

يوم الثلاثاء، واصل زوج العملات EUR/USD حركته الهبوطية الطفيفة بما يتماشى مع الاتجاه السائد. بعد حركة صعودية قوية إلى حد ما، بدأ السوق في تصحيح. طبيعة الانخفاض الحالي تتماشى تمامًا

Paolo Greco 08:28 2025-07-09 UTC+2

توصيات التداول ومراجعة التداول لزوج الجنيه الإسترليني/الدولار الأمريكي في 9 يوليو

واصل زوج الجنيه الإسترليني/الدولار الأمريكي الانخفاض الذي شهده الأسبوع الماضي طوال يوم الثلاثاء. للتذكير، كان هناك العديد من العوامل التي تدعم قوة الدولار الأمريكي المحتملة الأسبوع الماضي، لكنه ارتفع

Paolo Greco 07:35 2025-07-09 UTC+2

توصيات التداول ومراجعة التجارة لـ EUR/USD في 9 يوليو

واصلت الزوج EUR/USD الانخفاض يوم الثلاثاء، على الرغم من عدم وجود مبرر أساسي لنمو الدولار. وقد أفيد أن دونالد ترامب قرر رفع الرسوم الجمركية ليس فقط ضد اليابان وكوريا الجنوبية

Paolo Greco 07:09 2025-07-09 UTC+2

كيف تتداول زوج العملات GBP/USD في 8 يوليو؟ نصائح بسيطة وتحليل التداول للمبتدئين

الرسم البياني لزوج الجنيه الإسترليني/الدولار الأمريكي لمدة ساعة واحدة يوم الاثنين، كان زوج الجنيه الإسترليني/الدولار الأمريكي يتداول بشكل جانبي بوضوح. في الإطار الزمني للساعة، استقر تحت خط الاتجاه الصاعد، ولكن

Paolo Greco 10:45 2025-07-08 UTC+2

كيفية تداول زوج العملات EUR/USD في 8 يوليو: نصائح بسيطة ومراجعة التداول للمبتدئين

مراجعة تداول يوم الاثنين: EUR/USD، مخطط 1H في يوم الاثنين، تداول زوج اليورو/الدولار الأمريكي مع ميل هبوطي، وحقق الدولار الأمريكي مكاسب قوية إلى حد ما. كما ذكرنا سابقًا،

Paolo Greco 10:09 2025-07-08 UTC+2

توصيات التداول وتحليل التداول لزوج الجنيه الإسترليني/الدولار الأمريكي في 8 يوليو

زوج العملات GBP/USD تراجع أيضًا يوم الاثنين. ومع ذلك، في مساره الهبوطي غير المؤكد، واجه الزوج خط Senkou Span B لمؤشر Ichimoku للمرة الثالثة—وفشل مرة أخرى في اختراقه. خلال الأيام

Paolo Greco 07:42 2025-07-08 UTC+2

توصيات التداول وتحليل الصفقات لزوج اليورو/الدولار في 8 يوليو

تداول الزوج EUR/USD باتجاه هابط يوم الاثنين، على الرغم من عدم وجود أسباب أساسية تدعم قوة الدولار. ومع ذلك، كان ارتفاع الدولار ضعيفًا، وهو ما يتضح بشكل خاص في الإطار

Paolo Greco 06:51 2025-07-08 UTC+2

GBP/USD: خطة التداول للجلسة الأمريكية في 7 يوليو (مراجعة تداولات الصباح)

في توقعاتي الصباحية، قمت بتسليط الضوء على مستوى 1.3602 وخططت لاستخدامه لتحديد نقاط الدخول إلى السوق. دعونا نلقي نظرة على الرسم البياني لمدة 5 دقائق ونحلل ما حدث. أدى الانخفاض

Miroslaw Bawulski 13:21 2025-07-07 UTC+2

EUR/USD: خطة التداول للجلسة الأمريكية في 7 يوليو (مراجعة التداولات الصباحية)

في توقعاتي الصباحية، قمت بتسليط الضوء على مستوى 1.1749 وخططت لاتخاذ قرارات دخول السوق بناءً عليه. دعونا نلقي نظرة على الرسم البياني لمدة 5 دقائق ونحلل ما حدث. أدى الانخفاض

Miroslaw Bawulski 13:20 2025-07-07 UTC+2
لا تستطيع التحدث الآن؟
اطرح سؤالك في الدردشة.
Widget callback
 

Dear visitor,

Your IP address shows that you are currently located in the USA. If you are a resident of the United States, you are prohibited from using the services of InstaFintech Group including online trading, online transfers, deposit/withdrawal of funds, etc.

If you think you are seeing this message by mistake and your location is not the US, kindly proceed to the website. Otherwise, you must leave the website in order to comply with government restrictions.

Why does your IP address show your location as the USA?

  • - you are using a VPN provided by a hosting company based in the United States;
  • - your IP does not have proper WHOIS records;
  • - an error occurred in the WHOIS geolocation database.

Please confirm whether you are a US resident or not by clicking the relevant button below. If you choose the wrong option, being a US resident, you will not be able to open an account with InstaForex anyway.

We are sorry for any inconvenience caused by this message.