empty
06.12.2023 02:35 PM
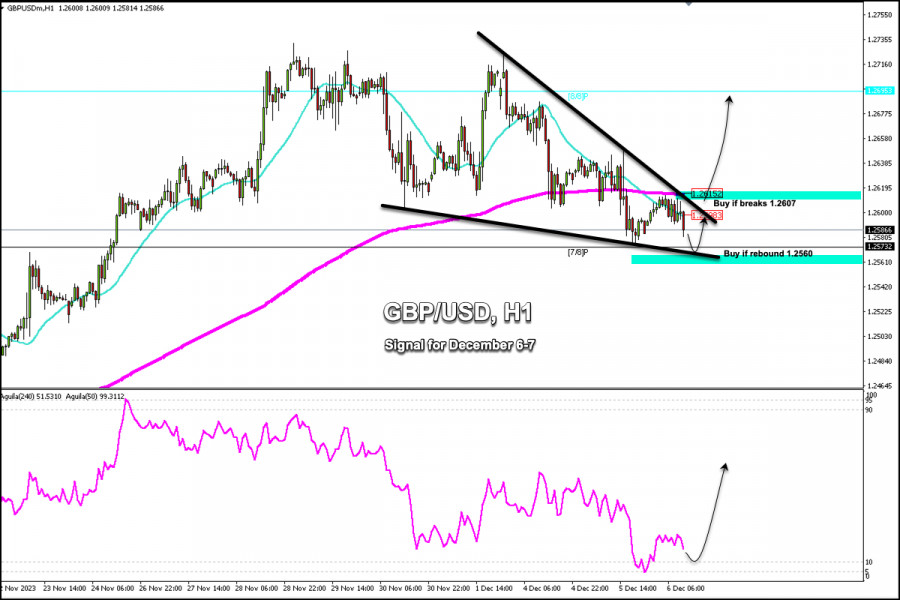
Trading Signals for GBP/USD for December 6-7, 2023: buy above 1.2560 (7/8 Murray - 21 SMA)

This image is no longer relevant

Early in the American session, the British pound is trading around 1.2586, below the 21 SMA, and below the 200 EMA. We can see a strong technical correction after GBP/USD reached the 1.2720 area.

In the H1 chart, we can see that the pound has formed a symmetrical triangle pattern. Therefore, GBP/USD is expected to go through a consolidation move between 1.2560 and 1.2607 in the coming days.

In case the British pound breaks the symmetrical triangle pattern and consolidates above the 21 SMA, we could expect a bullish move to occur and the instrument could reach 8/8 Murray at 1.2695.

On the other hand, should the British Pound continue its consolidation, we expect a technical bounce within the symmetrical triangle pattern around 1.2560 which could be seen as an opportunity to buy.

The eagle indicator reached the oversold zone. So, any pullback should be used as an opportunity to buy provided that the British pound consolidates above 7/8 Murray.

Market sentiment shows a mixed outlook on the British Pound with 45.36% of traders buying the pair. Because our strategy is contrary to the market consensus, we expect the British pound to consolidate above the psychological level of 1.25 in the coming days. Hence, we foresee a technical rebound.

Our trading plan for the next few hours is to buy the GBP/USD pair only in case there is a break above 1.2607 or in case the British pound bounces above 1.2560. The eagle indicator is producing oversold signals, thus supporting our bullish strategy.

Dimitrios Zappas,
الخبير التحليلي لدى شركة إنستافوركس
© 2007-2025
حدد الإطار الزمني
5
د
15
د
30
د
1
س
4
ساعات
1
يوم
1
أسبوع
كسب عائد من تغيرات أسعار العملات المشفرة مع إنستافوركس.
قم بتحميل منصة التداول ميتاتريدر 4 وافتح أول صفقة.
  • Grand Choice
    Contest by
    InstaForex
    InstaForex always strives to help you
    fulfill your biggest dreams.
    انضم إلى المسابقة

المقالات الموصى بها

التحليل الفني لحركة السعر اللحظية لمؤشر ناسداك 100، الخميس 17 أبريل 2025.

من خلال ما نراه على الرسم البياني لمدة 4 ساعات لمؤشر Nasdaq 100، هناك عدة أمور مثيرة للاهتمام، وهي أولاً، حركة السعر تتحرك تحت المتوسط المتحرك (100)، ثانياً، ظهور

Arief Makmur 06:27 2025-04-17 UTC+2

إشارات التداول للذهب (XAU/USD) للفترة من 16 إلى 18 أبريل 2025: البيع تحت مستوى 3,320 دولار (تشبع شرائي - 21 SMA)

في بداية الجلسة الأمريكية، يتداول الذهب حول 3,312 مع ميل صعودي بعد كسره للمثلث المتماثل. من المرجح أن يستمر الذهب في الارتفاع في الساعات القادمة، ليصل إلى مستوى 7/8 موراي

Dimitrios Zappas 18:20 2025-04-16 UTC+2

توقعات الفوركس 16/04/2025: اليورو/الدولار الأمريكي، الجنيه الإسترليني/الدولار الأمريكي، الدولار الأمريكي/الدولار الكندي، النفط والبيتكوين

روابط مفيدة: مقالاتي الأخرى متوفرة في هذا القسم دورة InstaForex للمبتدئين التحليلات الشائعة افتح حساب تداول مهم: يجب على المبتدئين في تداول الفوركس أن يكونوا حذرين للغاية عند اتخاذ القرارات

Sebastian Seliga 09:55 2025-04-16 UTC+2

التحليل الفني لحركة السعر اللحظية لأزواج العملات السلعية USD/CAD، الأربعاء 16 أبريل 2025.

على الرسم البياني لمدة 4 ساعات، يمكن ملاحظة أن زوج العملات السلعية USD/CAD يتحرك تحت المتوسط المتحرك الأسي (100) وظهور نمط Bearish 123، بالإضافة إلى وضع مؤشر Stochastic Oscillator الذي

Arief Makmur 07:37 2025-04-16 UTC+2

التحليل الفني لحركة السعر اللحظية لأزواج العملات المتقاطعة AUD/JPY، الأربعاء 16 أبريل 2025.

مع اقتراب مؤشر ستوكاستيك من مستوى التشبع البيعي (20) على الرسم البياني لمدة 4 ساعات لزوج العملات المتقاطع AUD/JPY، فإن هناك احتمالاً في المستقبل القريب لضعف AUD/JPY إلى مستوى المنطقة

Arief Makmur 07:35 2025-04-16 UTC+2

توقعات EUR/USD ليوم 16 أبريل 2025

أمس، كانت مؤشرات الثقة الاقتصادية لمنطقة اليورو لشهر أبريل مخيبة للآمال. حيث انخفض المؤشر من 39.8 في مارس إلى -18.5، وهو أقل بكثير من التوقعات التي كانت عند 13.2. نعتقد

Laurie Bailey 05:12 2025-04-16 UTC+2

توقعات GBP/USD ليوم 16 أبريل 2025

يواصل الجنيه الإسترليني الارتفاع وفقًا للسيناريو الذي حددناه سابقًا (انظر المرجع)، متجهًا نحو النقطة المغناطيسية عند 1.3311، وهي نقطة التقاطع مع الحد العلوي لقناة السعر الصاعدة على الرسم البياني اليومي

Laurie Bailey 05:12 2025-04-16 UTC+2

توقعات USD/JPY ليوم 16 أبريل 2025

على الرسم البياني اليومي، شكّل السعر مثلثًا صغيرًا حول مستوى 143.45 واستقر تحته. نظرًا لأن الهدف الأقرب عند 141.70 قريب، فإن السعر يهدف الآن إلى مستوى أدنى — 139.59 (القيعان

Laurie Bailey 05:12 2025-04-16 UTC+2

إشارات التداول للذهب (XAU/USD) للفترة من 15 إلى 18 أبريل 2025: البيع تحت مستوى 3,220 دولار (+1/8 Murray - 21 SMA)

في بداية الجلسة الأمريكية، يتداول الذهب حول 3,220، مما يظهر علامات على الإرهاق. من المحتمل حدوث تصحيح تقني إضافي نحو 21SMA في الساعات القادمة. على الرسم البياني H4، يمكننا

Dimitrios Zappas 14:05 2025-04-15 UTC+2

التوقعات لزوج العملات GBP/USD في 15 أبريل 2025

على الرسم البياني الساعي، استمرت الزوج GBP/USD في الارتفاع يوم الاثنين وأمن موقعًا فوق مستوى 1.3139. وبالتالي، قد يستمر الحركة الصعودية نحو المستوى التصحيحي التالي في فيبوناتشي عند 161.8%

Samir Klishi 11:59 2025-04-15 UTC+2
لا تستطيع التحدث الآن؟
اطرح سؤالك في الدردشة.
Widget callback
 

Dear visitor,

Your IP address shows that you are currently located in the USA. If you are a resident of the United States, you are prohibited from using the services of InstaFintech Group including online trading, online transfers, deposit/withdrawal of funds, etc.

If you think you are seeing this message by mistake and your location is not the US, kindly proceed to the website. Otherwise, you must leave the website in order to comply with government restrictions.

Why does your IP address show your location as the USA?

  • - you are using a VPN provided by a hosting company based in the United States;
  • - your IP does not have proper WHOIS records;
  • - an error occurred in the WHOIS geolocation database.

Please confirm whether you are a US resident or not by clicking the relevant button below. If you choose the wrong option, being a US resident, you will not be able to open an account with InstaForex anyway.

We are sorry for any inconvenience caused by this message.