empty
30.03.2023 01:28 PM
Technical analysis of BTC/USD for March 30, 2023

This image is no longer relevant

Trading BTC/USD :

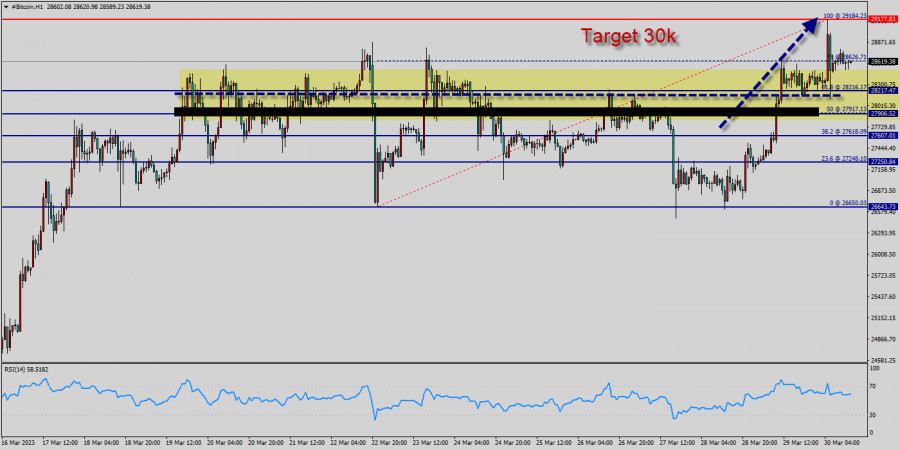
Bitcoin The bullish trend is currently very strong for BITCOIN - BTC/USD. As long as the price remains above the support at 28k USD, you could try to take advantage of the bullish rally in short term. The first bullish objective is located at 28,626 USD (this price is coincided with the ratio 78% of Fibonacci retracement levels).

The bullish momentum would be revived by a break in this resistance. Closing above the pivot point (28k USD) could assure that BTC/USD will move higher towards cooling new highs. The bulls must break through 29k USD in order to resume the up trend. Buyers would then use the next resistance located at 29,184 USD as an objective (this price is coincided with the ratio 100% of Fibonacci retracement levels - the double top - te last bullish wave on the hourly chart).

Crossing it would then enable buyers to target 29k USD. Be careful, given the powerful bullish rally underway, excesses could lead to a short-term rebound. Bitcoin's price has been consolidating between the 28k USD and 30k USD over the last few weeks, following a massive rising from the 28k USD mark.

So far, the price has been supported by the 28k USD - 27k USD range. If this is the case, remember that trading against the trend may be riskier. It would seem more appropriate to wait for a signal indicating reversal of the trend.

However, considering the current price action and the third rejection from this area, a run to the 29k USD support level and the 50-day moving average seems more likely. A bullish breakout from these levels would initiate a rally towards the 29k USD - 30k USD supply zone – a key level to which the price's reaction would determine the mid-term trend of the market.

In the very short term, the general bearish sentiment is confirmed by technical indicators. Nevertheless, a small upwards rebound in the very short term could occur in case of excessive bearish movements.

After finding bids reach to 29k USD, bitcoin price recovered above 26k USD, 27k USD and 28k USD. Initial Bitcoin resistance lies near the 28,626 USD level (78% of Fibonacci retracement levels).

A decent breakout and follow-up move above 28,626 USD could open the gate for a push towards the 29k USD level. The main resistance remains near the area of 29k USD - 30k USD.

Also it should be noted that Bitcoin and cryptocurrencies unite as the bears lose their momentum. The market is indicating a bullish opportunity above the above-mentioned support levels, for that the bullish outlook remains the same as long as the 100 EMA is headed to the upside.

Trading BTC/USD :

An uptrend will start as soon, as the market rises above resistance level 28k USD, which will be followed by moving up to resistance level 29k USD. Further close above the high end may cause a rally towards 30k USD. Nonetheless, the weekly resistance level and zone should be considered.

Mourad El Keddani,
الخبير التحليلي لدى شركة إنستافوركس
© 2007-2025
Summary
Urgency
Analytic
Mourad El Keddani
Start trade
كسب عائد من تغيرات أسعار العملات المشفرة مع إنستافوركس.
قم بتحميل منصة التداول ميتاتريدر 4 وافتح أول صفقة.
  • Grand Choice
    Contest by
    InstaForex
    InstaForex always strives to help you
    fulfill your biggest dreams.
    انضم إلى المسابقة

المقالات الموصى بها

التوقعات لليورو/الدولار الأمريكي في 13 أغسطس 2025

يوم الثلاثاء، واصل زوج اليورو/الدولار الأمريكي حركته الصعودية بعد الارتداد من مستوى تصحيح 50.0% عند 1.1590. كما استقر فوق منطقة المقاومة بين 1.1637–1.1645 ووصل إلى مستوى 1.1695. الارتداد

Samir Klishi 11:56 2025-08-13 UTC+2

التوقعات لزوج الجنيه الإسترليني/الدولار الأمريكي في 13 أغسطس 2025

على الرسم البياني لكل ساعة، ارتد زوج الجنيه الإسترليني/الدولار الأمريكي يوم الثلاثاء مرة أخرى من منطقة الدعم 1.3416–1.3425 وتحول لصالح الجنيه، ليتماسك بعد ذلك فوق مستوى فيبوناتشي 76.4% عند 1.3482

Samir Klishi 11:48 2025-08-13 UTC+2

GBP/USD. تحليل المؤشرات في 13 أغسطس 2025

يوم الثلاثاء، تحرك الزوج صعودًا إلى مستوى التصحيح 85.4% عند 1.3522 (الخط الأحمر المتقطع)، ثم انخفض ليغلق الشمعة اليومية عند 1.3495. اليوم، قد يستمر في التحرك صعودًا. يوم الأربعاء،

Stefan Doll 11:45 2025-08-13 UTC+2

اليورو/الدولار الأمريكي. تحليل المؤشرات في 13 أغسطس 2025

يوم الثلاثاء، تحرك الزوج صعودًا على خلفية الأخبار، ووصل إلى الفراكتال 1.1698 (الخط المنقط الأصفر)، ثم تراجع، مغلقًا الشمعة اليومية عند 1.1673. اليوم قد يستمر في التحرك صعودًا. من المتوقع

Stefan Doll 11:38 2025-08-13 UTC+2

لا يزال زوج XAU/USD تحت الضغط، على الرغم من وجود إمكانيات محدودة للتعزيز. الأربعاء، 13 أغسطس 2025.

[XAU/USD] – [الأربعاء، 13 أغسطس 2025] يبدو أن XAU/USD يحاول اختبار مستوى الدعم الأقرب له، كما أكد مؤشر RSI (14) الذي يقع في المنطقة المحايدة-الهابطة، ولا تزال كلا من EMAs

Arief Makmur 08:25 2025-08-13 UTC+2

على الرغم من احتمالية حدوث تصحيح هبوطي، يظل زوج العملات AUD/USD في حالة ميل نحو القوة. الأربعاء، 13 أغسطس 2025.

[AUD/USD] – [الأربعاء، 13 أغسطس 2025] مع وضعية AUD/USD حيث لا يزال EMA(50) أعلى من مستوى EMA(200) و RSI (140) في المنطقة المحايدة-الصعودية، يبقى التحيز لهذا الزوج من العملات السلعية

Arief Makmur 08:25 2025-08-13 UTC+2

توقعات EUR/USD ليوم 13 أغسطس 2025

حاول اليورو مرة أخرى أمس اختبار مقاومة خط التوازن. هذه المرة، كان مدعومًا من الأسواق الخارجية — حيث ارتفع مؤشر S&P 500 بنسبة 1.14% وحتى سجل أعلى مستوى

Laurie Bailey 05:00 2025-08-13 UTC+2

توقعات GBP/USD ليوم 13 أغسطس 2025

استفاد الجنيه الإسترليني بالأمس بشكل كامل من الضعف المؤقت في الدولار، ليصل إلى المستوى الوسيط الثاني عند 1.3525. يرتفع مؤشر مارلين في منطقة الاتجاه الصاعد، والآن يحتاج السعر

Laurie Bailey 05:00 2025-08-13 UTC+2

توقعات الفضة ليوم 13 أغسطس 2025

ارتفعت الفضة بنسبة 0.41% أمس. عاد السعر فوق خط مؤشر التوازن، وقد ينضم قريبًا مؤشر مارلين، الذي يقترب من التحرك نحو منطقة الاتجاه الصاعد، إلى النمو. قد يكون الاختراق المتكرر

Laurie Bailey 04:59 2025-08-13 UTC+2

إشارات التداول للذهب (XAU/USD) للفترة من 12 إلى 15 أغسطس 2025: الشراء فوق $3,341 أو البيع تحت $3,335 (21 SMA - 200 EMA)

إذا انخفض الذهب إلى ما دون 3,340، فقد يكون التوقع سلبيًا. يمكن أن يستأنف حركته الهبوطية، وقد نتوقع أن يصل الأداة إلى 5/8 Murray عند 3,320 وفي النهاية إلى 4/8

Dimitrios Zappas 13:34 2025-08-12 UTC+2
لا تستطيع التحدث الآن؟
اطرح سؤالك في الدردشة.
Widget callback
 

Dear visitor,

Your IP address shows that you are currently located in the USA. If you are a resident of the United States, you are prohibited from using the services of InstaFintech Group including online trading, online transfers, deposit/withdrawal of funds, etc.

If you think you are seeing this message by mistake and your location is not the US, kindly proceed to the website. Otherwise, you must leave the website in order to comply with government restrictions.

Why does your IP address show your location as the USA?

  • - you are using a VPN provided by a hosting company based in the United States;
  • - your IP does not have proper WHOIS records;
  • - an error occurred in the WHOIS geolocation database.

Please confirm whether you are a US resident or not by clicking the relevant button below. If you choose the wrong option, being a US resident, you will not be able to open an account with InstaForex anyway.

We are sorry for any inconvenience caused by this message.